
Repeated Measures Analysis of Variance
via Randomization

As of the time of this writing, I will restrict my discussion to designs with one repeated measurement, and no between-subjects measures.
Test statistic
Just as we did with the one-way analysis of variance on independent samples, we will use the normal F statistic. It summarizes the differences between means, and eliminates the effects of between-subjects variability.
Procedure
With repeated measures, we want to permute the data within a subject, and we don't care about between-subject variability. If there is no effect of treatments or time, then the set of scores from any one participant can be exchanged across treatments or time. In what follows I will assume that the repeated measure is over time, though there is no restriction that it need be.
- Calculate the F for Time in the obtained data, and denote that as Fobt.
- Permute the data within each participant, and do it for every participant.
- Calculate an F for Time on the permuted data.
- If this F is greater than Fobt, increment the counter.
- Repeat the preceding three steps B times, where B > 1000.
- Divide the value in the counter by B to obtain the probability of obtaining an F as large as Fobt if the null hypothesis were true. Denote this value as p.
- Reject the null hypothesis of no difference due to time if p is less than our chosen level of a.
An example
The following example is loosely based on a study by Nolen-Hoeksema and Morrow (1991). The authors had the good fortune to have measured depression in college students two weeks before the Loma Prieta earthquake in California in 1987. After the earthquake they went back and tracked changes in depression in these same students over time. The following example is based on their work, and assumes that participants were assessed every three weeks for five measurement sessions.
I have changed the data from the ones that I have used elsewhere to build in a violation of our standard assumption of sphericity. I have made measurements close in time correlate highly, but measurements separated by 9 or 12 weeks correlate less well. This is probably a very reasonable thing to expect, but it does violate our assumption of sphericity.
If we ran a traditional repeated-measures analysis of variance on these data we would find
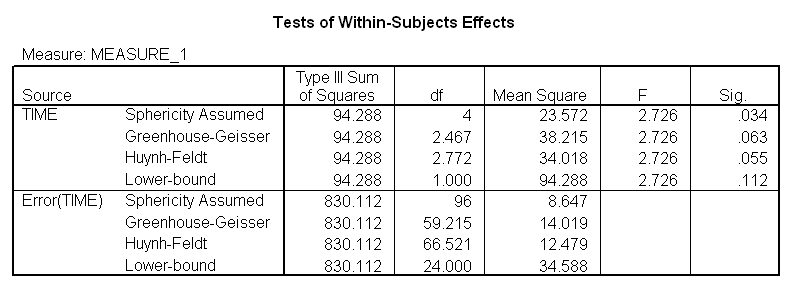
Notice that Fobt = 2.726, which is significant, based on unadjusted df, with p = .034. Greenhouse and Geisser's correction factor is 0.617, while Huynh and Feldt's is 0.693. Both of these lead to an increase in the value of p, and neither is significant at a = .05. (The F from a multivariate analysis of variance, which does not require sphericity has p = .037.)
If we apply a randomization test to these data we obtain:
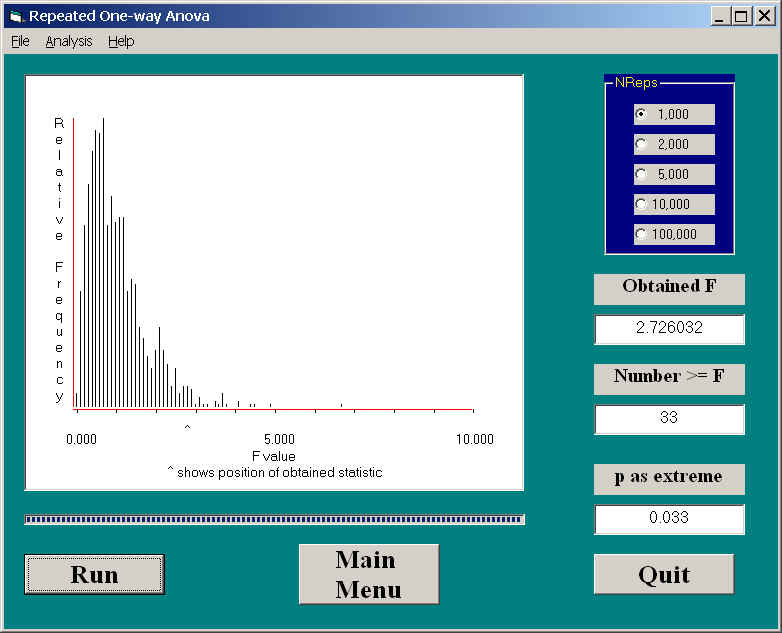
Notice that our sample F is the same, as it should be, and the associated p is .033. This agrees closely with the p value for the MANOVA, and with the unadjusted p value for the F. It does not agree, however, with either of the adjusted p values. Here we have a situation where the p computed from the randomization test would allow us to reject the null hypothesis of no difference, but the p computed from the appropriate adjustment of Greenhouse and Geisser would not allow rejection.
R for Repeated Measures
Usually I would give the code for R here, but I have written a much more complex set of analyses in R and want to make a special page for them. They cover various kinds of repeated measures. However I will give the code with very little discussion, because I think that you should be able to follow the logic behind the analyses. You can find that page at
"http://www.uvm.edu/~dhowell/StatPages/Randomization%20Tests/RepeatedMeasuresAnovaR.html "
dch:
David C. Howell
University of Vermont
David.Howell@uvm.edu