

We can expand our randomization test on two independent groups to a one-way analysis of variance on multiple groups quite easily. (Expanding it to factorial designs is a different story, which requires quite a different web page). We will deal with multiple groups in a oneway design simply by permuting the combined data across all of the groups.
With the two group example, I said that the choice of a test statistic was simplified by the fact that we would get the same result if we chose the mean of the first group, the difference between the two means, or a t on the two means, because these are equivalent statistics. The problem is not quite so simple when it comes to an analysis of variance, because we have multiple means. Thus, at the very least, we have to take into account the means of all of the groups. That still leaves a lot of latitude, but unfortunately not all of our choices will lead to equivalent statistics--though some will.
One common choice is to calculate SSbetween on the group means, and use that as our metric. I prefer to go a step further and calculate the traditional F on group differences. (This actually takes the same amount of time using R, and it allows us to compare the randomization distribution with the parametric distribution of F.) This is an equivalent statistic to SSbetween, and it is one with which we are familiar.
The basic procedure is quite predictable from what you already know. We will
A good example of a traditional one-way analysis of variance is the study by Foa et al. (1991) comparing treatment of rape victims. I have described this study elsewhere, but it can be summarized briefly by saying that there were four conditions. One group received Stress Innoculation Therapy (SIT), a second received Prolonged Exposure (PE), a third received standard Supportive Counseling (SC), and the last was a Wait-List control group (WL). The dependent variable was the rated severity of symptoms.
The means, standard deviations, and sample sizes are shown below, and the data can be found at Foa.dat.
Group n Mean St. Dev. SIT 14 11.07 3.95 PE 10 15.40 11.12 SC 11 18.09 7.13 WL 10 19.50 7.11
The results of 5000 random resamplings from these 45 observations appear below.
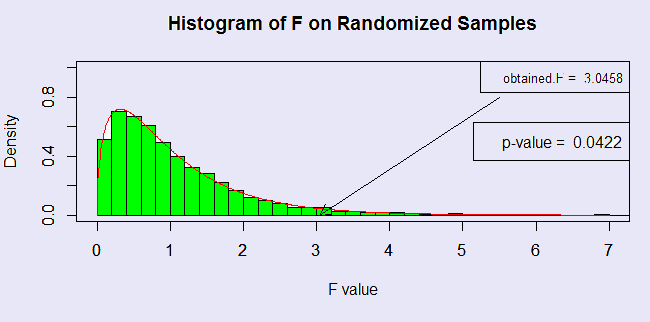
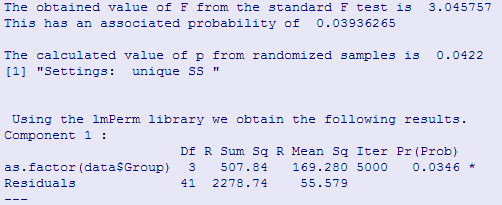
Here you can see the sampling distribution of the resampled F, which, in this case, looks very much like the tabled sampling distribution. You can see the the obtained F = 3.046, which is the F you would have from any standard analysis of variance program. The associated p value is .042. This is obtained by noting the number of resamplings with an F greater than 3.046.
In the figure above I have superimposed the exact sampling distribution of F simply so that you can see how well that distribution fits our results.
The consolidated results are shown next. The results from the lmPerm library have a probability value that is roughly the same as the other two probability values that we have calculated.
The code for the above analysis can be found at onewayAnova.r. It is also shown below. This code not only explains how the analysis was carried out, but it provides the graphic display showing the results. An easier solution, which does not produce a graphical result, can be found in the lmPerm package, which can easily be downloaded and install from the R site. Because of its broad utility, I have illustrated its use below.
# Randomization test for one way ANOVA
# Data file has column1 = group and column2 = dv
# This data file has unequal n's

data <- read.table("http://www.uvm.edu/~dhowell/StatPages/ResamplingWithR/RandomOneway/Foa.dat", header = TRUE)
names(data)
data$Group <- as.factor(data$Group)
nreps <- 5000
N <- length(data$Score)
n.i <- as.vector(table(data$Group))   # Create vector of sample sizes
k <- length(n.i)

model <- anova(lm(data$Score ~ data$Group))
obt.F <- model$"F value"[1]     # Our obtained F  statistic
cat("The obtained value of F from the standard F test is ",obt.F, "\n")
cat("This has an associated probability of ", obt.p,  "\n")
samp.F <- numeric(nreps)
counter <- 0
set.seed(1086)
for (i in 1:nreps) {
  newScore <- sample(data$Score)
  newModel <- anova(lm(newScore~data$Group))
  samp.F[i] <- newModel$"F value"[1]
  if (samp.F[i] > obt.F) counter = counter + 1
  }
#time2 <- proc.time()
#cat(" The timing statistics are " ,(time2 - time1),"\n")
pvalue <- counter/nreps
cat("\nThe calculated value of p from randomized samples is ",pvalue, "\n \n")
par(mfrow = c(2,1))
hist(samp.F, breaks = 50, main = "Histogram of F on Randomized Samples",
   xlab = "F value", probability = TRUE, col = "green", border = 1,
   , xlim = c(0,7), ylim = c(0,1))
 legend("topright", paste("obtained.F = ", round(obt.F, digits = 4)), col=1,  cex = 0.8)
 legend("right",paste("p-value = ",round(pvalue, digits = 4)))
 arrows( 5.5, 0.8,obt.F,0, length = .125)

f <- seq(0, 7,.01)
dens <- df(f,3,41)
par(new = T)
plot(f,dens, col = "red", type = "l", xlim = c(0,7), ylim = c(0,1), xlab = "", ylab = "")
#polygon(f,dens, col = "red")


# Demonstration of lmPerm library
library(lmPerm)
result <- summary(aovp(data$Score ~ as.factor(data$Group), perm = "Exact", seqs = FALSE))
cat(" Using the lmPerm library we obtain the following results. \n")
print(result)
Multiple Comparisons
The standard multiple comparison procedures for randomization tests of multiple groups has not been worked out as nicely as they have been for the analysis of variance. But for a one-way between-subjects analysis of variance, the simplest way to deal with multiple comparisons is to restrict yourself to pairwise comparisons of groups, and to run a randomization test of two independent groups. If you run several of these, you should use a standard Bonferroni adjustment (or a more powerful variant of that) to control error rates. An excellent book on this topic is Westfall and Young (1993).
References
Foa, E. B., Rothbaum, B. O., Riggs, D. S., & Murdock, T. B. (1991) Treatment of posttraumatic stress disorder in rape victims: A comparison between cognitive-behavioral procedures and counseling. Journal of Consulting and Clinical Psychology, 59, 715-723.
Westfall, R. H. & Young, S. S. (1993) Resampling-based multiple testing. New York: John Wiley & Sons.
dch:
David C. Howell
University of Vermont
David.Howell@uvm.edu