Regression to the mean is something that confuses many people, not just students. The classic example is from Galton, who predicted that tall parents would have children who are shorter than they are, while short parents should have children who are taller than they are. People's first problem is that they don't believe it. Once are forced to see that it is true, their second thought is that this will mean that over time the population will become more and more heterogeneous in height, which we know not to be true.
Regression to the mean is a difficult problem to teach. It isn't hard to show that it is logically true, but it is hard to explain why we aren't all 58" tall. This page is a brief attempt to explain both. To do so I will use the data that Galton used, thanks to xxxxx. This data set has two variables. The first is called "midparent" and it is the average height of the parents. The mother's height was first multiplied by a constant (I think that it was 1.2) to adjust for the normal difference in heights between men and women. The second variable is "child," which is the height of their child, again adjusted for gender. Heights were rounded to the nearest half inch, which is why the resulting graph looks grid-like. The heights are plotted below, along with the regression line.
The best fitting regression line is
PredChild = 46.135 + 0.326*Midparent
Thus if we take a 72 inch set of parents, we predict that their child will be 46.135 + 0.326*72 = 69.61 inches. If we take a 62 inch set of parents their child is predicted to be 66.35 inches tall. Thus tall parents are predicted to have shorter children and shorter parents are predicted to have taller children.
But maybe you don't believe this. Maybe you think that in general the slope should be steeper, even though these data gave a flattish slope. But think of regression with standardized data. Then the intercept will be 0 and the slope (often called beta for standardized data) will equal r, which in this case is 0.46. Here again a parent who is 2 standard deviations above the mean will have a child who is predicted to be 2*.46 = .92 standard deviation above the mean. Again for the shorter parents. And we know that the slope can never be greater than 1.00 because the correlation can never be greater than 1.00
So why aren't we all 58 inches tall? The answer is that regression to the mean deals with individual data points, not with populations. Elsewhere I have drawn a similar kind of analogy to this. You all know that over the long haul, grades on quizzes tend to have roughly the same spread. Regression to the mean should work there to--the person with the highest grade on quiz one is not likely to be the person with the highest grade on quiz two. Their grade is likely to go down. But grades are made up of two components. The first is how much you know, and the second is luck about what questions were asked. I would suspect that the person who had the heighest grade knew a lot, but also just happened to be quite lucky in the questions. On the next quiz she may still know an awful lot, but she is unlikely to be extraordinarily lucky twice in a row. Someone else will have the best luck. So someone who was lower than she was on quiz one will probably be luckier than she is on quiz two. So it is the people near, but not at, the top of the pack that keep the average up next time, even though they, too, will suffer from regression to the mean.
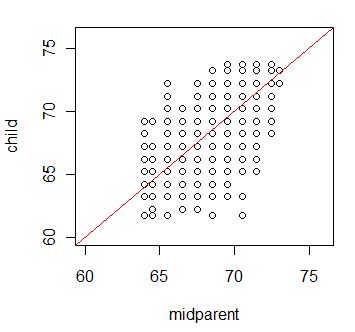
Another way to look at this is to plot the data with a 45 degree line through it. That represents children and parents who are the same height. Such a graph follows.

Here you can see that most of the tall parents had children shorter than they were. But you can also see that there is enough error in the system (by that I mean Y - Yhat) that other children take their place and the mean stays high. In this case the mean of the parenets was 68.31, while the mean of the children was 68.09.
 Return
to Dave Howell's Statistical Home Page
Last modified 11/21/09