(Or, setting confidence limits on increment in r-squared when adding other variables)
![]()
![]()
Psychologists often are interested in noting the contribution that one variable makes to the regression, over and above a set of other variables that frequently are thought of as control variables. This is nothing but the squared semi-partial correlation of that variable with the dependent variable, with all other variables held constant. As such, its contribution is partially indexed by the regression coefficient for that variable in the full model, and its significance is tested by the t or F test on that regression coefficient.
However, current practice would also call for some effect size measure in addition to a test of significance. Clearly the squared semi-partial itself qualifies as a measure of effect size, but some people would also call for a confidence interval on that squared semi-partial. That is the purpose of this page.
In most situations in which we create a confidence interval, that interval itself provides a test of a null hypothesis. If the interval does not include 0, we would declare the difference to be significant, and if it does include 0 we would declare the difference to be nonsignificant. However, in the current situation this does not hold. Adding a variable to a regression model can never lead to a decrease in r-squared, and so we would never expect the interval to include negative values, no matter how useless the added variable. So before computing the interval in question, you need to examine the standard test on the regression coefficient. If that is not significant, I would not recommend calculating a confidence interval, on the grounds that the new variable does not make a reliable contribution to the prediction.
Alf and Graf (1999), building on the work of Olkin and Finn (1995) developed a procedure for constructing confidence limits on the difference between two squared correlations. A special case of this, and the only one presented here, is the case in which one set of predictors is a proper subset of the predictors in the other correlation.
The formula arrived at by Alf and Graf is unpleasantly messy, but it is not difficult to follow. All that we need to do is to plug in the necessary statistics from our data analysis.
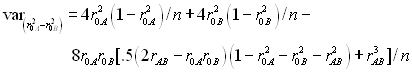
The confidence interval for the squared semi-partial correlation coefficient is given as
.
where A represents the complete set of predictors, and B represents a subset of predictors.
Notice that this interval is written in terms of z = 1.96, instead of a critical value of t. Notice also the "infinity sign" subscripting "var." These are indication that this formula relies on asymptotic results, meaning that it is only exactly correct for infinitely large samples. However, Alf and Graf, along with Olkin and Finn (1995) suggest that it can be used "judiciously" when 60 < n < 200, and without qualms when n > 200.
The problem with this equation comes in finding an estimate of the standard error of the difference in r-squared. Alf and Graf first define
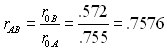
where rAB is the correlation between the two sets of predictors. They then define
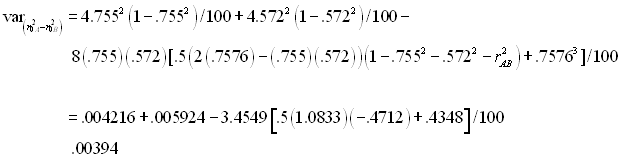
In the 5th edition of Howell, D. C. (2002) Statistical Methods for Psychology I use the example of traditional course evaluation surveys. Students rate the course on a number of dimensions, including the instructor's teaching skills, knowledge of the material, difficult of exams, the size of the course, and the student's anticipated grade. The question of interest is whether the instructor's teaching skills contribute to our ability to predict the ratings over and above the other listed aspects of the course. Letting r20A represent the squared multiple correlation with all predictors present, and r20B represent the squared correlation for a model that does not including Teach as the predictor, we have
r20A =.755 and r20B = .572. Then
Then
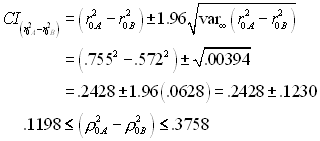
To get the confidence interval on the squared semi-partial correlation we have the formula given above.
All components of this equation are now known, and we can compute
Notice that even at the low end of the confidence interval the squared semi-partial correlation accounts for nearly 12% of the variation in overall ratings, whereas at the high end it counts for nearly 38%. Clearly teaching skills are an important part of an instructor's teaching ratings.
Olkin, I. & Finn, J. D. (1995) Correlations redux. Psychological Bulletin, 118, 155-164.
![]()
![]()
Last revised: 10/26/01