
Multiple Imputation Using SPSS
David C. Howell

Using SPSS to Handle Missing Data
SPSS will do missing data imputation and analysis, but, at least for me, it takes some getting used to. Because SPSS works primarily through a GUI, it is easiest to present it that way. However I will also provide the script that results from what I do.
The data file is named CancerHead-9.dat and contains the following variables related to child behavior problems among kids who have a parent with cancer. (The "-9" in the title of the file is there to remind me that this file used "-9" for missing data, which is a common notation for missing data in SPSS. (You could also use 999, 99, or whatever set of values you want.) Once the data are read in, you go to the Variable View and enter the missing value (e.g. -9) as the missing data entry for each variable. The "Head" tells me that the names of the variables are to be found in Line 1. Several of the variables in this example relate to the parent (patient) with cancer. The other variables relate to the spouse of the patient. The variable names are, in order, SexP (sex parent), DeptP (parent's depression T score), AnxtP (parent's anxiety T score), GSItP (parent's global symptom index T score), DeptS, AnxtS, GSItS (same variables for spouse), SexChild, Totbpt (total behavior problem T score for child). These are a subset of a larger dataset, and the analysis itself has no particular meaning. I just needed a bunch of data and I grabbed an available file related to a research project with which I was involved. We will assume that we want to predict the child's Total Behavior Problem T score as a function of several other variables. I no longer recall whether the missing values were actually missing or whether I deleted a bunch of values to create an example.
The first few cases are shown below. Notice that variable names are included in the first line. Missing data are indicated by "-9".
SexP	DeptP	AnxtP	GSItP	DeptS	AnxtS	GSItS	SexChild	Totbpt
2   50   52   52   44   41   42   -9   -9
1   65   55   57   73   68   71   1   60
1   57   67   61   67   63   65   2   45
2   61   64   57   60   59   62   1   48
2   61   52   57   44   50   50   1   58
1   53   55   53   70   70   69   -9   -9
2   64   59   60   -9   -9   -9   -9   -9
1   53   50   50   42   38   33   2   52
2   42   38   39   44   41   45   -9   -9
2   61   61   55   44   50   42   1   51
1   44   50   42   42   38   43   -9   -9
2   57   55   51   44   41   35   -9   -9
-9   -9   -9   -9   57   52   57   2   65
2   70   59   66   -9   -9   -9   1   61
2   57   61   52   53   59   53   2   49
We read in the data as we normally do in SPSS, in my case as a "dat" file. Then from the Analyze menu choose Multiple Imputation and then select Impute Missing Values. When you have made the necessary assignments of variables to the role you will have a menu that looks like the following.
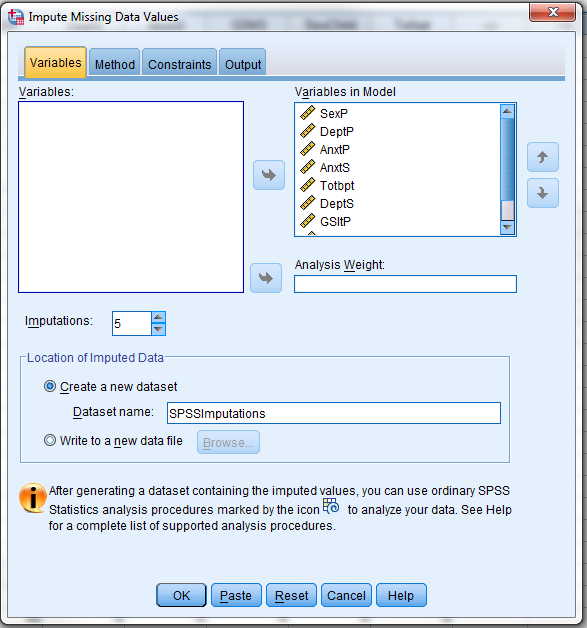
Notice that I have included all nine variables in doing the imputations, even though I will only use six of them in the regressions. I do this because those extra variables may be able to add importantly to the imputed values. For example, suppose that I had a second measure of depression, but chose not to use in in the final analysis. That measures would presumably be nicely correlated with DeptP, and would be useful in imputing missing data for that variable. So I include it here, even though I drop it later.
The important thing to notice here is the section called "Location of Imputed Data." I have taken the default and specified that the new dataset will be named SPSSImputations. It is important to note that this will NOT create a file in your directory with that name. It will create a file in your current session to which we will turn very shortly.
I am not going to present the output from that procedure because it doesn't get us very far. Basically you will see a list of variables with their means, standard deviations, etc. from the raw data and from the imputed data. You should look at that, but it is not very exciting.
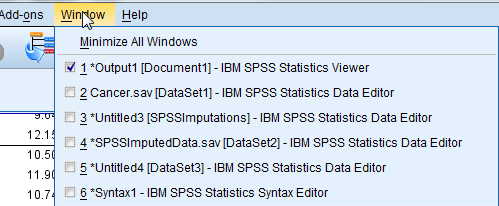
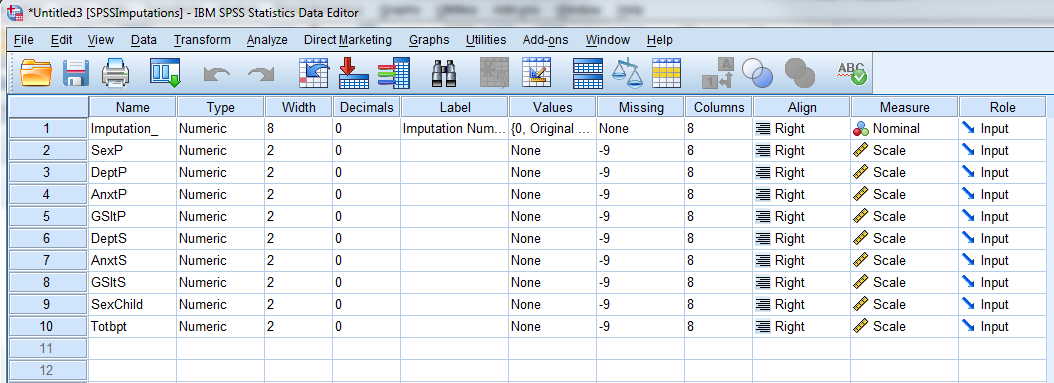
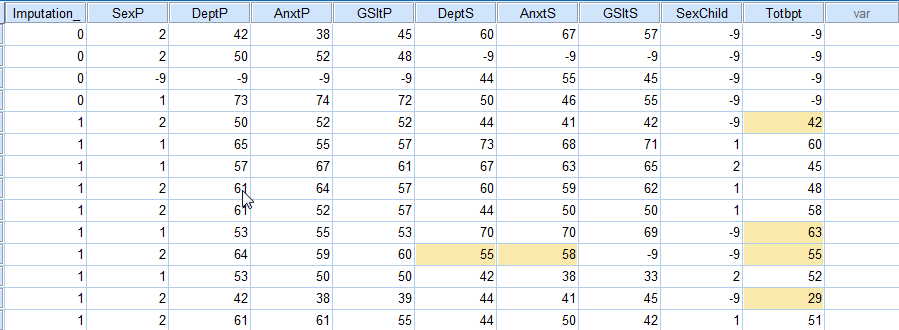
This step of the procedure doesn't look as if it has done much for us, but in fact it has. It has created five data sets containing imputed values, and those are held in SPSSImputations. If you go to the Window tag in the main SPSS Window, it will offer you the choice of going to that data set. You can see this in the following image. There are other choices in that window because I have created other stuff as I wrote this page, but you want to select "Untitled[SPSSImputations]-IBM SPSS Statistics Editor." When you make that selection you will get the following data set. Notice that it looks like the original, but with a new variable called "Imputation_." This will consist of the numbers 0 to 5, referring to the particular imputation session. (Imputation = 0 refers to the original data file.) You can see part of that data file below, showing the last few lines of the original data and the first few lines of the data from imputation 1. The areas shaded in yellow are imputed values where the value was missing in the original.
Now we are ready to do our analysis, but we do it in kind of a strange way. If you look back at the first window that I showed you, you will see a note at the bottom referring to a special icon. This means that if you now take this new data set and go to the standard Analyze menu, you will see that some of the procedures have this icon next to them. That really means that if you use this data set with that procedure, SPSS will recognize that you want to combine imputed data sets and will allow you to do so. For example, we want to use linear regression to predict Totbpt from 5 other variables. You set this up as follows
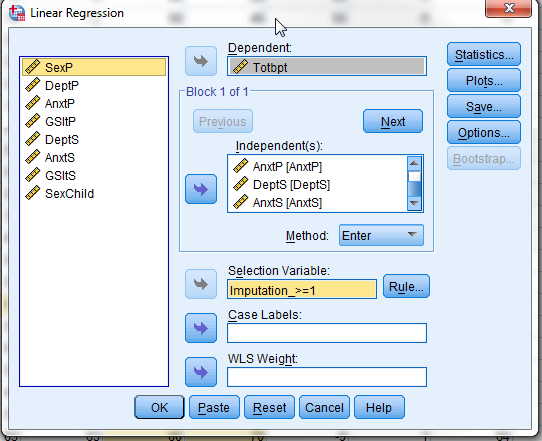
Notice that I have added "Imputation_ to the box labeled "Selection Variable" and used the "Rule" to specify that I want it to use all imputations numbered 1 or more. The partial results of this printout follow.
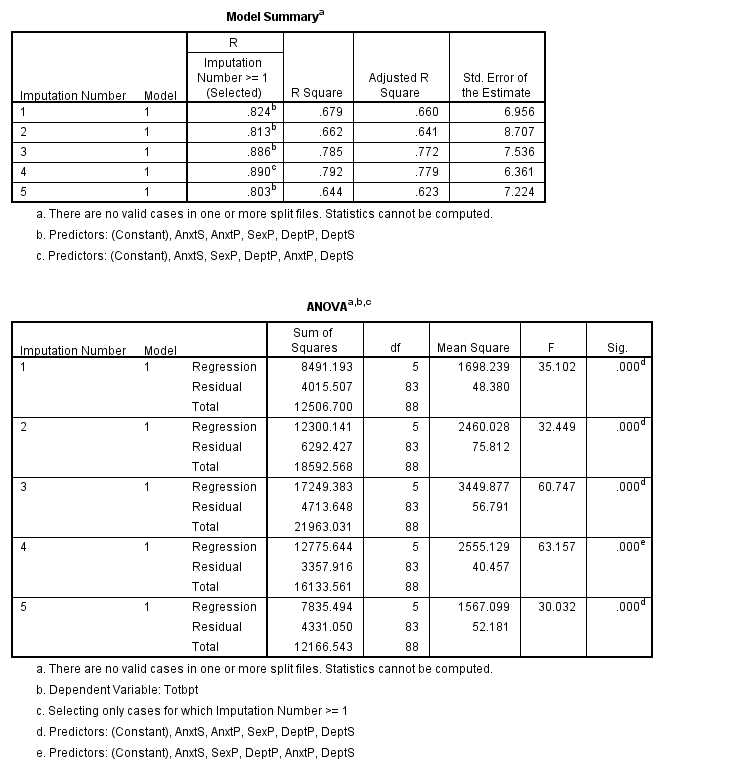
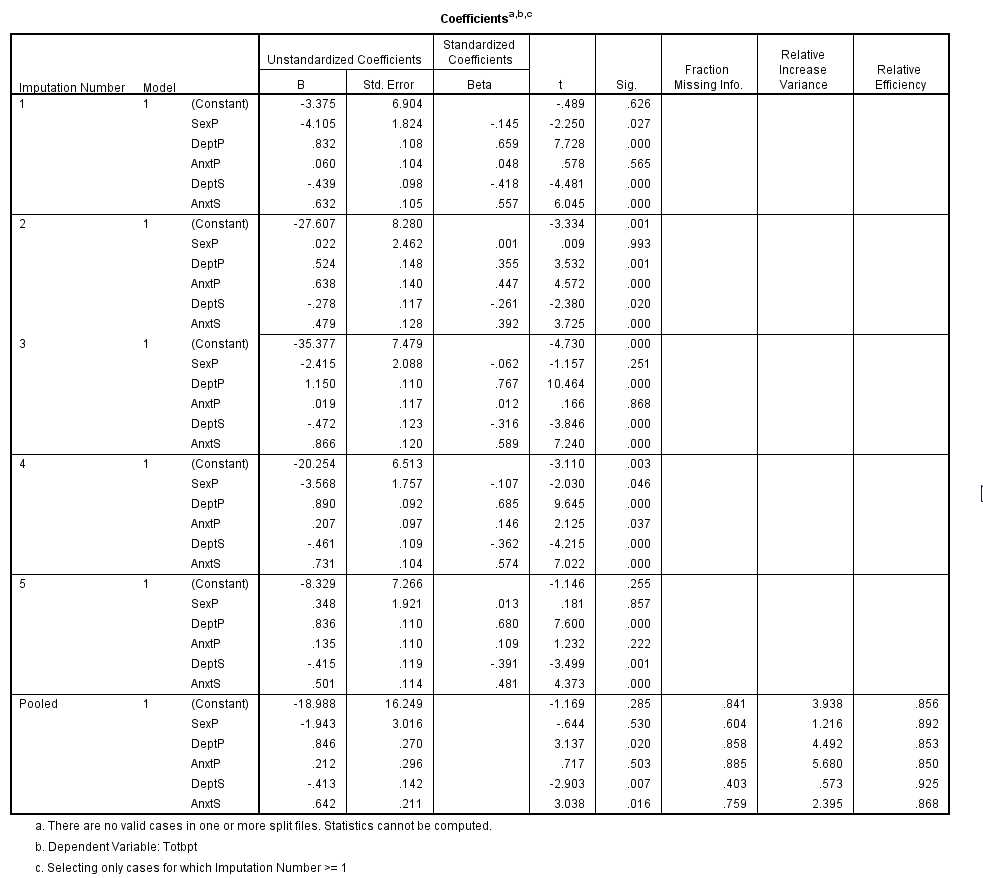
The important part is the last set of output. It shows you what the regression coefficients, their standard errors, etc were for the 5 separate imputations, and then it shows you for the "pooled" data. This is the result you were looking for, and is comparable to what we found in the last bit of printouts for NORM and SAS. The values will not be exactly the same, but they will be reasonably close.I think that the "error message" in that last window is not an error message. It is simply saying that I did not chose to include Imputation 0, which was the original data.
SPSS Syntax
For those who like to work with syntax rather than focussing on the GUI, the syntax for this analysis follows.
*Impute Missing Data Values.
DATASET DECLARE SPSSImputations.
MULTIPLE IMPUTATION SexP DeptP AnxtP AnxtS Totbpt DeptS GSItP GSItS SexChild
  /IMPUTE METHOD=AUTO NIMPUTATIONS=5 MAXPCTMISSING=NONE
  /MISSINGSUMMARIES NONE
  /IMPUTATIONSUMMARIES MODELS DESCRIPTIVES
  /OUTFILE IMPUTATIONS=SPSSImputations .

DATASET ACTIVATE DataSet2.

REGRESSION
  /SELECT=Imputation_ GE 1
  /MISSING LISTWISE
  /STATISTICS COEFF OUTS CI(95) R ANOVA
  /CRITERIA=PIN(.05) POUT(.10)
  /NOORIGIN
  /DEPENDENT Totbpt
  /METHOD=ENTER SexP DeptP AnxtP DeptS AnxtS
  /SAVE SRESID.
Last revised 6/29/2015