
![]()
![]()
The following links are to three separate printouts for the study of methanol poisoning by Seyed Masoompour. They were produced by the ODS system of SAS. The original SAS syntax is pasted below. The data are proprietory and meant only for his use.
The first page contains the data from 5 multiple imputations to replace missing data in his results. The first column lists the imputation number. He collected data on more variables, but these were the variables used to do the imputation because they had the best chance of fitting missing values. The ethanol and methanol data are the ones where the vast majority of the replaced observations can be found. These could be cut out and pasted into the larger data set if desired. (I was able to highlight the data on the web page and paste it into a standard text editor such as Notepad.) The imputed values that came out below 0 were replaced by 3.00 because all patients should have had some methanol and ethanol levels greater than 0. Using a 3.00 is in line with the minimum values found by Hovda et al. in their 2005 study.
The link to the data is sashtml15.htm
After the data were imputed, all five sets were entered into separate logistic regression procedures to predict outcome from the other variables in the data set. This produced 5 separate printouts (not shown) for the multiple regressions.
The output from these five logistic regressions were combined by SAS's proc mianalyze procedure. Essentially this procedure averages over the 5 logistic regression results, taking into account both the variability of estimates within each regression, but also the variability across the five regressions. You can best think of these as the results from one large logistic regression and they can be reported as pooled logistic regression coefficients. I can find a reference if needed.
The link to these results is sashtml16.htm
Finally, I ran individual t-tests between the two levels of outcome for each of the variables in this data set. There is no reason why you could not take the data in the first printout and add it to the data for all other variables and run t-tests for those other variables. (You could do the same with logistic regression.) There are five printouts here because there is a printout for each imputed data set. I think that I could combine them using something equivalent to proc mianalyze, but I am not entirely sure.
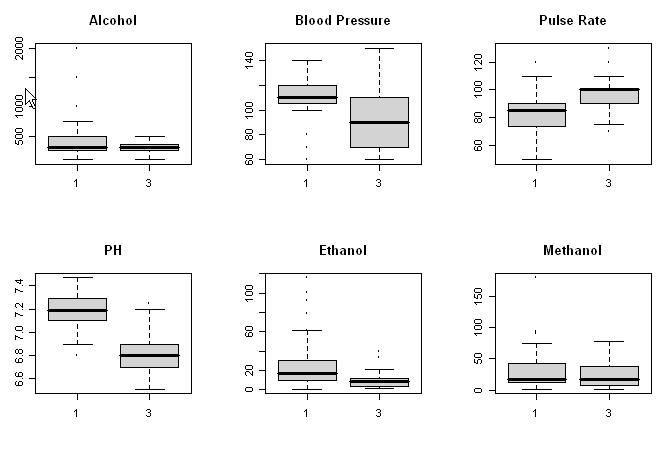
The following link will take you to boxplots of some of the variables.
There are three categorical variables in this data set in addition to outcome. I have created tables for each and run a chi-square test on each. This was done in R, so the printout is not as attractive. These appear below.
&&&&&&&&&&&&&&&&&&&&&&&&&&&&&&&&&&&&&&&&&&&&&&&&&&&&&&&&&&&&&&&&&&&&
> table(LOC, outcome)
   outcome
LOC  1  3
  1 37  4
  2 20  2
  3  4  1
  4  1 14
> chisq.test(LOC, outcome, correct = F)

        Pearson's Chi-squared test

data:  LOC and outcome
X-squared = 45.1091, df = 3, p-value = 8.772e-10


&&&&&&&&&&&&&&&&&&&&&&&&&&&&&&&&&&&&&&&&&&&&&&&&&&&&&&&&&&&&&&&&&&&&
> table(hospital, outcome)
        outcome
hospital  1  3
       1  8  8
       2 27  9
       3 24  4
       4  3  0
> chisq.test(hospital, outcome, correct = F)

        Pearson's Chi-squared test

data:  hospital and outcome
X-squared = 7.9799, df = 3, p-value = 0.04643

&&&&&&&&&&&&&&&&&&&&&&&&&&&&&&&&&&&&&&&&&&&&&&&&&&&&&&&&&&&&&&&&&&&&
> table(fundoscopy, outcome)
          outcome
fundoscopy  1  3
         1 33  3
         2 29 18
> chisq.test(fundoscopy, outcome, correct = F)

        Pearson's Chi-squared test

data:  fundoscopy and outcome
X-squared = 9.6846, df = 1, p-value = 0.001858

&&&&&&&&&&&&&&&&&&&&&&&&&&&&&&&&&&&&&&&&&&&&&&&&&&&&&&&&&&&&&&&&&&&&
The SAS syntax is given below. I do not have the add-on in SPSS to do multiple imputation via that software.
/* Multiple Imputation for Seyed Masoompour's Data. This is the
   second set of data with some of the 32 variables removed. */

  ods html;
  ods listing;

  data Masoompour;
    infile 'Masoompournew.dat';
    input ID hospital alcohol LOC BP PR fundoscopy PH ethanol methanol outcome;
  run;

  proc mi data=Masoompour noprint out=miout1 seed=37851;
    EM maxiter = 1000;
    var hospital alcohol LOC BP PR fundoscopy PH ethanol methanol outcome;
  run;

  data miout;
    set miout1;
    if ethanol < 0 then ethanol = 3;
    if methanol < 0 then methanol = 3;
  run;

  proc print data = miout;
  run;

  proc logistic data=miout outest=outreg covout noprint;
    model outcome= alcohol LOC BP PR fundoscopy PH ethanol methanol;
    by _Imputation_;
  run;
/*
proc print data=outreg(obs=8);
var _Imputation_ _Type_ _Name_
Intercept methanol BP PR;
title ’Parameter Estimates from Imputed Data Sets’;
run;
*/

  proc mianalyze data=outreg;
    modeleffects alcohol LOC BP PR fundoscopy PH ethanol methanol;
  run;

  Proc TTest Data = miout;
    Class outcome;
    var  alcohol LOC BP PR fundoscopy PH ethanol methanol;
  Run;

  quit;
David C. Howell
2/14/2008
![]()
![]()