Click the link below and save the following JMP file to your Desktop:
Now go to your Desktop and double click on the JMP file you just downloaded.
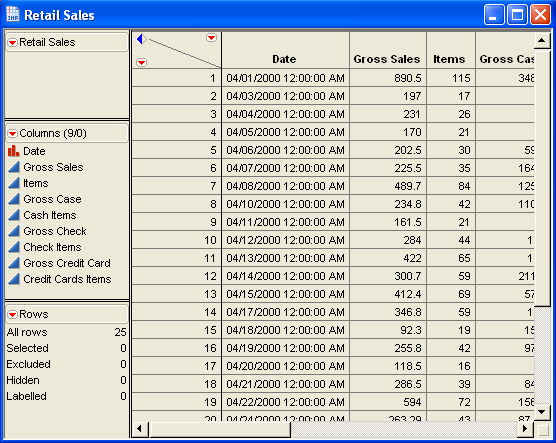
This action will start JMP and display the content of this file:
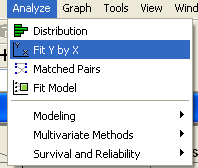
Go to the Analyze menu and select Fit Y by X:
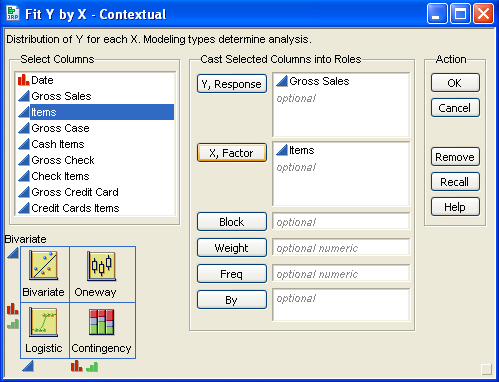
Click the column Gross Sales, then click Y, Response.
Click the column Items, then click X, Factor.
Your screen should now look similar to the following:
Click OK.
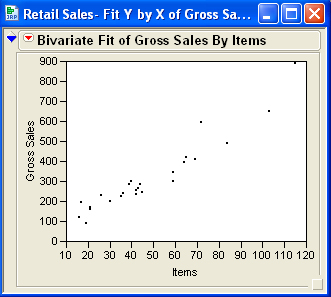
The scatter plot is produced:
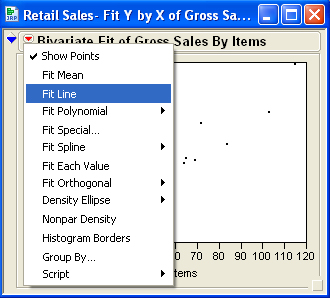
Click on the red down arrow next to Bivariate Fit of Gross Sales By Items and select Fit Line:
You should see:
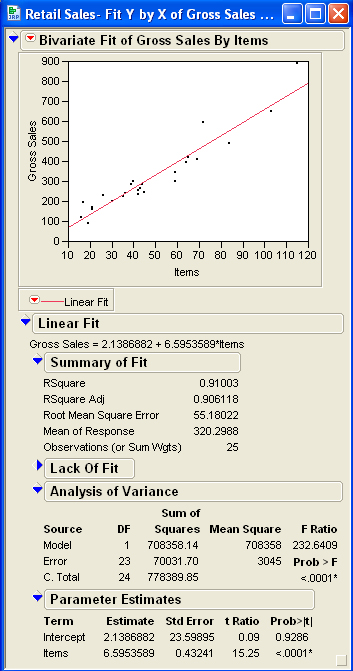
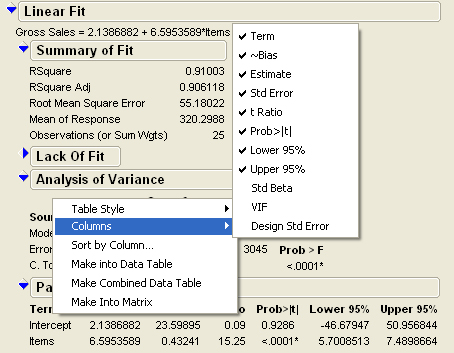
The t Ratios, displayed in the Parameter Estimates output, are the t values for testing the null hypothesis that the corresponding population regression coefficients are zero. And, the values under Prob>|t| are the p-values associated with the same tests (and, with a 2-sided alternative hypothesis).
To get a 95% confidence intervals for the population regression coefficients,
right click on the Parameter Estimates area (below the words Parameter
Estimates).
Go to Columns, then select Lower 95%, then Upper 95% as follows: