Computed Tomography (CT)
Introduction to Computed Tomography (CT)
Lesson Objectives
- Describe how CT images are obtained including basic physics, artifacts, and image processing techniques.
- Identify the different reconstructions used in CT (ie: coronal, sagittal, axial).
- Summarize when CT is the imaging modality of choice.
- Identify when the use of IV or oral contrast is indicated.
- Recognize and determine appropriate management of contrast reactions.
Basics of CT
CT uses x-rays to obtain images.
Much of the same principles that you learned about x-rays still apply.
- Ionizing radiation (x-ray photons) passes through patient.
- X-rays reach detector to form an image.
CT Scanner
- Unlike plain films, radiation source and multiple detectors rotate around the patient.
- Computer collects data as patient moves through the scanner.
- Density for each pixel can be calculated.
Axial Plane
- Data is typically obtained in the axial plane.
- Cross sectional "slice" through the patient.
- Viewed as if you are looking at the patient from the foot of the bed.
Sagittal plane
- Data already obtained in the axial plane can be reconstructed in the sagittal plane.
- Viewed as if you are looking at the patient from the side.
Coronal plane
- The coronal plane can also be reconstructed from the original axial data set.
- Slices viewed as if you are in front of the patient, looking at them standing upright.
3D imaging
- In addition to the 3 planes of imaging (axial, sagittal, and coronal), CT data can also be used to create 3D images.
- Helpful for visualization of vasculature and bony structures (complex fractures and surgical planning).
(Need pictures of 3D bone and 3D vessels*)
Density
- Dense material absorb x-rays and prevent them from reaching the detector.
- Air – does not absorb many x-rays – most reach detector – appears dark.
- Bone – absorbs more x-rays – few reach detector – appears light on image.
- In CT, we are able to measure the amount of x-rays that are transmitted (pass through) to the detector to get a value corresponding to the density of the material.
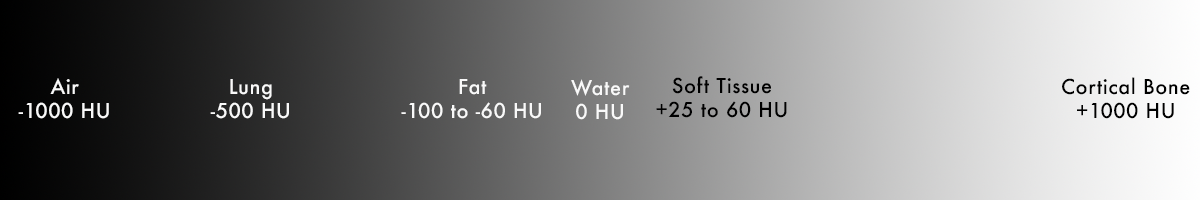
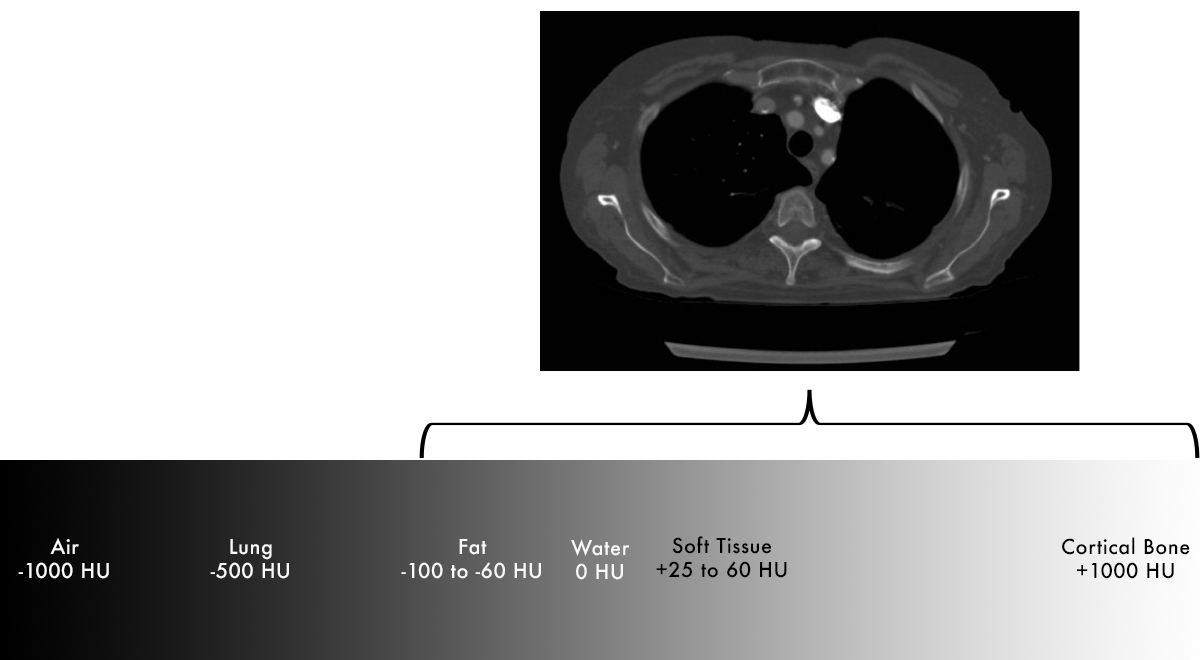
- Tissue density is measured in Hounsfield units (HU).
Hounsfield Units
Definition
- Water = 0 HU
- Air = -1000 HU
- Everything else = scaled based on density relative to air/water
Air < Fat < Fluid < Soft tissue < Bone < Metal

Fat
- Fat is less dense than water, negative HU
- Fat floats on water – easy way to remember this.

Soft Tissue and Blood
- Soft tissue is mostly intracellular water, but also contains additional substances (connective tissues) that raise the density slightly
- Positive HU, but not far from water (+25 to +60)

Lung
- Lung is a mixture of soft tissue and air – overall density of lung falls between these two values

Bone
- Cortical bone – extremely dense – highly positive HU (+1000)
- Medullary bone – mix of dense bone and soft tissue (+300)
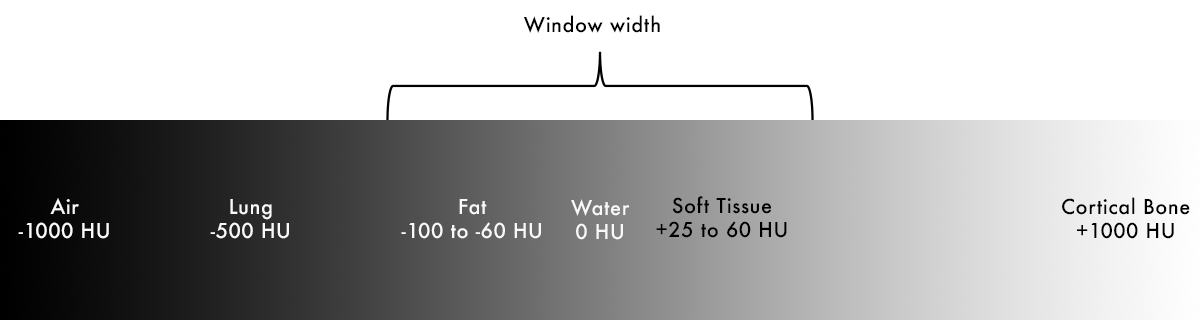
Windowing
- Focuses our gray scale to the tissues of interest – this is the "window width"
- Highlights subtle differences in tissues
- All densities below the specified values are black
- All densities above the specified values are white
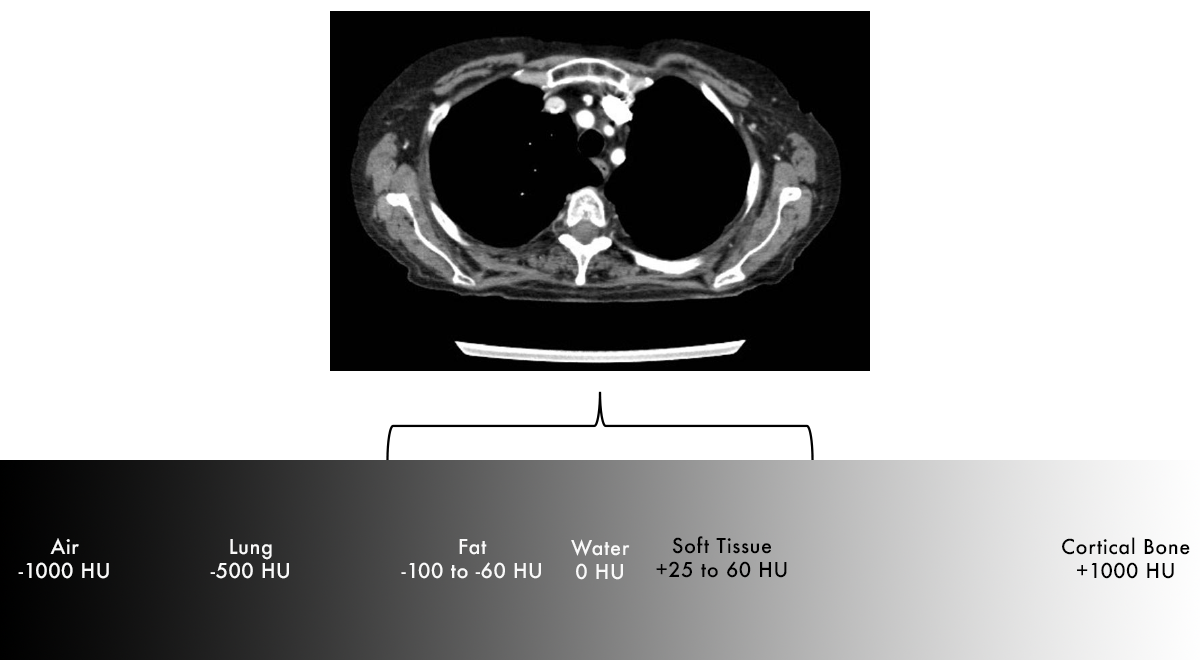
Soft Tissue Window
- It is now very easy to tell the difference between fat (dark grey) and soft tissue (light grey)
- Notice that air (outside of patient) and lungs look exactly the same because they are outside of our specified window of HU values
Lung Window
- On the previous image we were unable to see the large pneumothorax
- Can now easily differentiate lung tissue from air in pneumothorax

Bone Window
- Can see differences in bony cortex and medulla
- Easier to detect fractures
Brain WIndow
- Window can be set narrowly enough that we can distinguish the very small differences in white matter and grey matter
- White matter is slightly less dense than grey matter due to presence of lipid-containing myelin
BRAIN IMAGE NEEDS TO BE REPLACED WITH ONE FROM PACS

CT Contrast
- CT contrast contains iodine, a relatively dense element that appears bright on CT.
- What actually "enhances"?
- Anything that receives blood flow, with brightness corresponding to amount of blood flow.
- Vessels
- Tumors – hypervascularity
- Inflammation/infection – increased blood flow and leaky capillaries.
Timing of contrast
- Arterial vs venous imaging is based on timing of image acquisition after contrast administration.
- Contrast is typically administered via a peripheral vein, flows to heart, then follows circulation throughout the rest of the body.
- Peripheral vein
- Right heart (RA/RV)
- Pulmonary arteries (image at this time point for PE study).
- Left heart (LA/LV)
- Aorta (image at this time point for CT angiogram).
- Peripheral arteries
- Capillaries
- Veins (image at this time point for evaluation of most abdominal organs).
- Back to heart
Renal excretion
- Each time contrast passes through the kidneys, some is removed via renal excretion, decreasing amount of contrast present in circulation over time.
- Contrast becomes concentrated in renal collecting system and bladder.
- Ureters and bladder fill on delayed images (image at this time point for CT urogram).
Contrast limitations
- Evaluation for intracranial hemorrhage – brightness from contrast will obscure bright blood, so we use a non-contrast head to rule out hemorrhage.
- Kidney stones – renal calculi are already dense on CT, so contrast is generally not needed/helpful.
- Renal impairment
- Iodinated contrast is cleared by the renal system.
- Generally avoid IV contrast if GFR < 30 mL/min due to higher risk of contrast induced nephropathy.
- Not an absolute contraindication – use clinical judgement to evaluate risks vs benefit.
- Hydration may reduce risk of AKI if low/borderline GFR.
- Oral hydration preferred.
- Normal saline if unable to drink fluids.
- Chronic dialysis – generally okay to give contrast as there is no residual renal function to preserve.
- No risk of nephropathy with oral contrast.