Having judged my share of high school science fairs, and guided undergraduates through independent research projects - some for papers and others for experiments - I thought I'd offer some thoughts on how projects could be both more scientific and more polished. Let me state up front that there is no silver bullet for the common problems I see. But a little preparation could go a long way! So here are some pretty easy steps towards a winning science fair project.
| Find
a
great question This isn't as difficult as it sounds. Go for a walk. Sit and meditate (not while watching TV or listening to music). Write down every question that pops into your head - from trivial to apparently profound. Sleep on it. Look at them again. Try to get up to 15 or 20 questions - more is better. Rank them - which ones are really cool? Which ones do you really want an answer for? Which ones are related to the subject matter of the science fair?  Why does light do that? Here is the catch: you need to do this way before the deadline for getting your project done - how far in advance depends on how much equipment you might need to round up or construct, and how much data you want to collect. For instance, if you want to raise tomato seedlings and run an experiment on them, how old must they be? I suggest doing this exercise sometime around the holidays if your science fair is in the spring. The best thing now is to get a bunch of folks together and brain storm your favorite choices. Explain your choices to each other, and defend them. Be critical (but not nasty) of your friends' choices. Debate answers for each question. |
| What
is
a testable hypothesis? Take your favorite questions - maybe the top 3 or 4. Propose answers to them, and write down the logic behind your answer. These are hypotheses for each topic. You can recognize the testable hypotheses because you can imagine realistic ways to collect data that might prove them wrong. Remember, the goal in science is not to prove an hypothesis right (there will always be exceptions). Rather, we look for ways to prove them wrong - the more often we fail at this endeavor (the data support the hypothesis) the stronger our idea is. 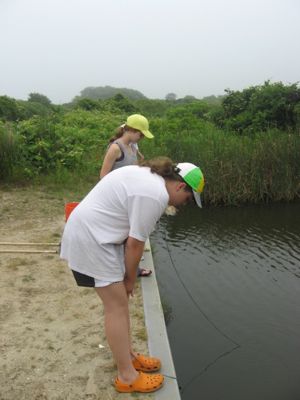 "I think crabs prefer bacon fat to Wonder bread" (that is a testable hypothesis…) As a trivial example consider a lamp that doesn't turn on. Why doesn't it turn on? is your question. Your answer to the question is "the light bulb is burnt out" and the logic is (of course) that if the bulb is burnt out, it cannot turn on. This is a testable hypothesis because you can figure out what kind of data (measurements or observations) you need to test it. If your questions are not trivial (and hopefully your favorite questions are not!), then you may need to do a bit of research here. Be sure to make notes of where you get your information - web sites should be approached with caution (even mine). But the references you gather here will be the first you can include in your science fair presentation, so you've got a head start for that, too. Again, get together with your friends - discuss your hypotheses, and what kind of data you need. Scientists don't work in a vacuum, and neither should you. If you can, bounce your ideas off of teachers, a mentor at a local college, or other adults. |
| Develop
a
procedure for collecting data Now that you have a hypothesis, and an idea of how to test it, you need to decide how to collect the data you need. Write down the steps you will use -- this is your protocol. Now make a list of equipment you need. Are you planning on an experiment, where you intentionally change something? In our trivial example about the lamp, our experiment would be to change the light bulb. Here is the catch - how can we test if the light bulb we remove is actually bad? Are there circumstances under which the light bulb might be good, but changing it still resulted in our lamp turning on? Yes - perhaps the original bulb wasn't bad but just loose in the socket. So how can we "control for" this alternative source of dysfunction? By testing the bulb in another lamp! Doing this is called "controlling for" other variables. In your own project, you need to spend some time contemplating other possible explanations for the responses you might see. And if at all possible, you need to control for them. A less trivial example comes from my own research: I wanted to know if the amount of food a juvenile spider eats alters how long they take to mature. But another source of differences in time to maturity could be genetic - that some spiders inherently take longer or shorter. To control for this, I used spiders from only one family, so that they were all pretty similar genetically.  One more step -- try out all of the steps in your protocol. Make sure your equipment works, make sure the questions in your survey are not ambiguous, make sure you can take the measurements you need within the time frame your protocol requires. These "pilot runs" are crucial to getting it right. At this point you should still have some time before the assignment is due so you can trouble shoot the protocol. Make sure that all the pieces come together, by testing the parts of the protocol and that unwanted factors are "controlled for." |
| Make
some
predictions One common mistake I see in science fairs is that students propose their predictions as "hypotheses." The easiest way to avoid this mistake is to not make any predictions until you have a protocol (indeed, you really cannot predict the outcome of research until you know what data you are going to collect!). So now that you have a protocol, you can make a prediction. In our lamp experiment, it looks like this: Observation - the lamp doesn't work Hypothesis - the light bulb is bad Protocol: 1. using lamp A, take out light bulb #1 and replace with light bulb #2 -- record if lamp A now works 2. put light bulb #1 into a lamp (B) that does work -- record if lamp B still works Prediction: lamp A with the new light bulb (#2) now works, lamp B with the old light bulb (#1) no longer works. 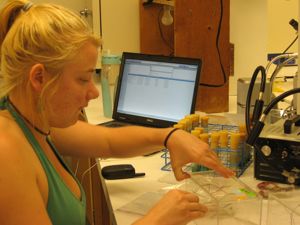 Now, take it back to your friends. Compare protocols and predictions - can you discover alternative explanations for their predicted results that would not be ruled out by the protocol? Help each other to brain storm protocols and ways to control for unwanted factors that could make your results ambiguous. Again, scientists do this all the time for each other, because we are often so in love with our hypotheses and protocols that we cannot see the alternative explanations. It is a lot easier to change things now rather than after you've run your experiment! Now you are set to collect data! |
Collect
your
data Hand me the ruler, please… Hand me the ruler, please… Rule number one (indeed the most important rule) in collecting data is… write it all down. Whether the measurements look "right" or not. You can't pick and choose which data to include in your results, you have to include them all. If something looks really odd, then you include it and in your evaluation (the next step) you discuss why that particular individual is different (if you have ideas) or at least point out that you know that something was different. If it is all going really wrong, stop. Rethink your protocol, draw a line across your data log, and start a new experiment. Now you are doing a second experiment, and you will have to keep the two sets of data separate. While you are writing down your measurements and observations, keep a log of what is happening around your experiment. Maybe the first three people to take your survey were comfortably taking a study break, but the next two were rushing to get to lunch. These kind of observations can help you determine if other factors played a role in your results. Note that I am writing of "measurementS" and "People taking a survey." You aren't doing the experiment just once - you need to do it many times. How else can you know if the results you got the first time are accurate? This is called "replication" and it is the only way to be sure that your results don't represent some kind of fluke. |
| Evaluation
You've designed a protocol and taken pictures of your equipment in action. You have collected data, and made pretty graphs (be sure to label your variables!). But don't just slap the graphs onto the poster board and declare them to be "results"! You need to interpret them. To do this, you compare your data to your predictions (no fair changing your predictions, by the way). If the data match your predictions, then your hypothesis is supported. If your data didn't match your predictions, then your hypothesis is rejected. 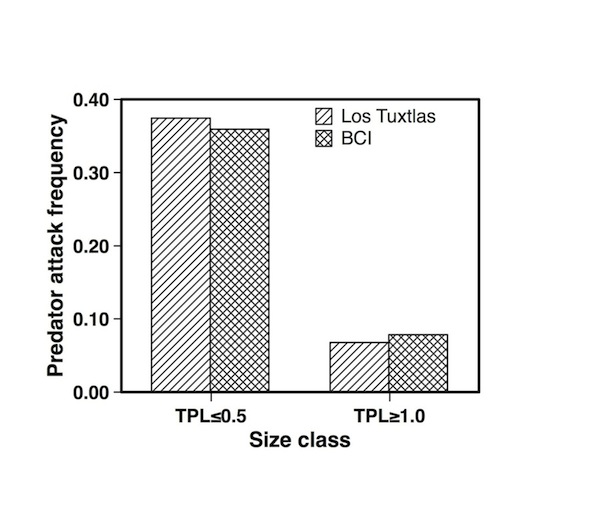 In either case, you need to explain, in a few sentences, what you observed and how it compares to your predictions. This is also your opportunity to discuss any runs of the experiment or participants in your survey where the data are "out of line" with the rest. If you know how, take the time to calculate mean and variation where relevant. If you are lucky enough to have many runs of your experiment, comparing means (with the variation) can be a lot easier than comparing all the data, for the readers of your poster. And you want your readers to find your poster easy to read! Give
your graphs titles more interesting than than just "Results."
This one is "Small spiders
are attacked more frequently than large spiders"
|
Revision
(and
Conclusions)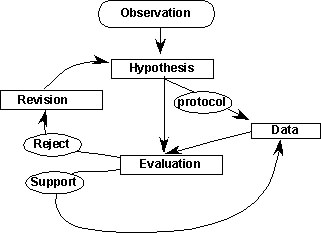 If your hypothesis is rejected, then you propose revisions to the hypothesis. But if your hypothesis is supported, you still need to do more: you need to propose different ways to run the experiment - to collect more data. Revision is one of the key components of science, and perhaps one of the most ignored. This is when you sit back and look at all you have done, and consider what could be better or different. You need to do this regardless of how your experiment turned out. Maybe the protocol didn't work at all - well then, revise the protocol itself. How would you do it differently, and (most importantly) why? Maybe the protocol was just fine, and your data support your hypothesis. You don't need a revision now, do you? Wrong. You've done just one experiment. If we think back to my spider experiment, I got a great response to food levels in the spiders. But perhaps this was just a peculiarity of this one family! So I need to do the experiment again – with spiders from lots of different families (different genes). Things can actually be more interesting when your data cause you to reject your hypothesis - because now you can wax poetic on alternative answers to your original question (alternative hypotheses), and how you would test them. (Note that they must be testable alternatives!). Going back to our lamp experiment, maybe in step #1, when we put the new bulb into the "bad" lamp, it still didn't turn on and in step #2, when we put the old bulb into the "control" lamp, it did turn on. Clearly our hypothesis that the bulb is bad is rejected. What other explanations can we find - the switch is bad, or the plug is loose in the outlet, or the socket is bad on the lamp. All of these are testable hypotheses, and you can briefly propose ways to test each of them. Note that you can often combine this section with your results, into a "results and discussion" section. Don't forget to put in "ideas for future study" section -- that gives you the opportunity to show your real understanding of the subject. |
Put
it
all together 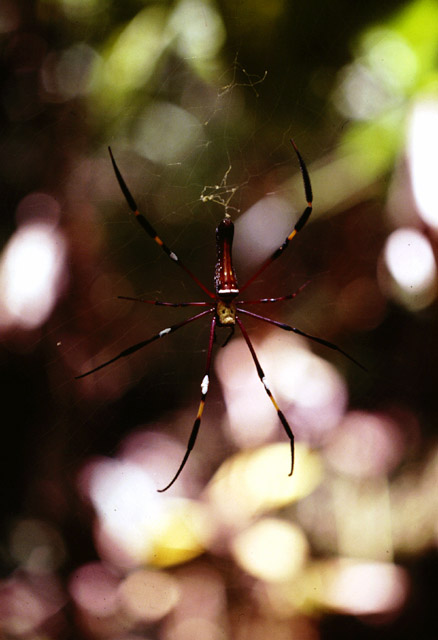 Leave yourself enough time to make a neat, nice presentation of your study. Here is a good web site for Poster Design. I know that few, if any, high schools can print an electronic poster but don't let that part of the process stop you from reading their recommendations - they apply to any poster. A few key points: 1. use large enough type that someone standing 5 feet away can read all the text (not just the title and headings). 2. keep the lay out simple and logical 3. choose one color scheme and stick to it 4. Fewer words are better than more. Tables are better than text. Graphs are better than tables (but you still need to explain them!). Note that a schematic or flow chart is often a really good substitute for a written description of your protocol. 5. label, label, label. Label the parts of the poster (hypothesis, background, protocol and predictions, results and conclusions – but not "Title"). Label the parts of the equipment or protocol if you include a schematic or photo. Label the graph of the data (not "Results" but something informative like "Changing the light bulb did not solve the problem"). Label the axes of the graph (not "X" and "Y" but "food availability" and "weight gain"). Label the measurements with units (seconds, grams, degrees Centigrade, centimeters). Make sure you have legends for your graphs (not "treatment 1" and "treatment 2" but "low food" and "high food"). 6. (but not least!) check your spelling, grammar and lay out before assembly. Don't rely on spell checkers -- spell checkers cannot differentiate between their and there, or son and sun. But your readers can! |