Click here to
Return to the 2009 Brownington, VT Preliminary Barn Census Page
An
Agricultural Narrative of
By Adriana J. Campany
Researching Historic Sites and Structures
The
agricultural history of a rural area can expose the story of a place in time
and give meaning to still standing structures from the past. Examining
available elements of historic data, such as old census records, maps, and
aligning these materials with current research can often prove to yield
accurate depictions of these bygone times. These elements can help families,
historians and preservationists explore and understand elements that are still
with us today. For the town of
Brownington
is, today, a quiet town in the midst of
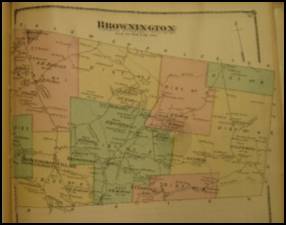
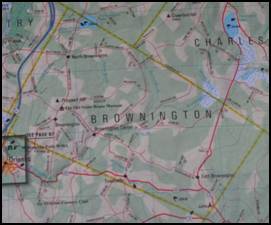
Figure 1 (Left): Beers Atlas of
Orleans County: Brownington, 1878. The
Society Website. (Retrieved
Figure 2 (Right):
The
town’s official start took place on
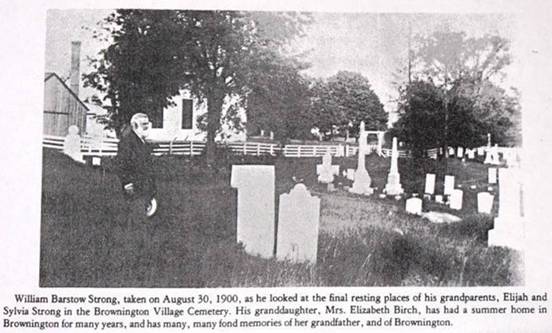
Figure 3: Willian
Ralph S. Swett. History
of
Courtesy of the
Brownington
was composed of three post villages, that of Brownington,
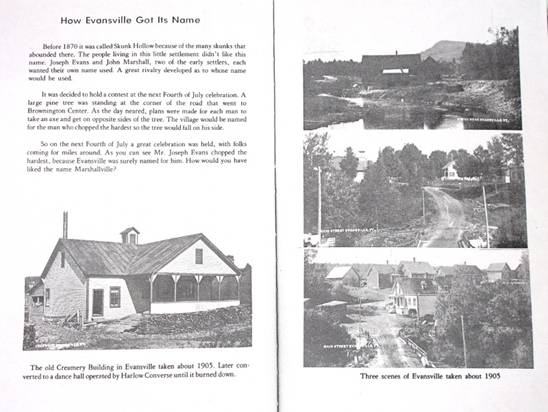
Figure 4: Old Creamery (bottom left) and three photographs of
Ralph S. Swett. History
of
Courtesy of the
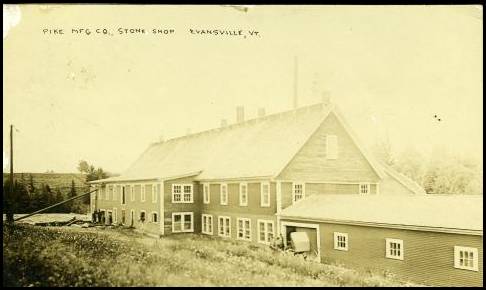
Figure 5: Stone Shop, Year Unknown,
Courtesy of the
Census records show that by 1800 the population of Brownington was 65 persons (see figure 6). [4] By 1810, the population had risen to 236 and it apparently hung on through the next decade, growing only to 265 persons, according to the census in 1820.
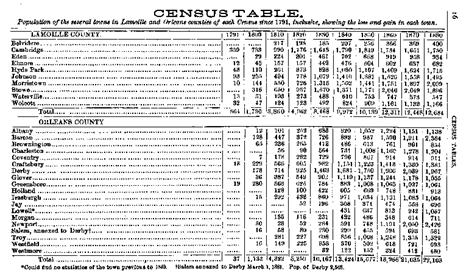
Figure 6 (Above): Population Census for Orlean’s County, Hamilton Child’s Gazetteer, p.16
The population between 1810 and 1820 seemed rather ill effected, noting a rather stagnant growth. First, the war of 1812 had a direct pull on individuals by setting in fear and panic. Many people within Brownington took their belongings and fled under the fear of war. No one, however, was injured or killed in Brownington by warring parties during this time span, but fear was enough for people to leave.[5]
This
decade also harbored a tragic harvest season between 1815 and 1816. Howard
Russell describes, in his book A Long
Deep Furrow, the Year without a
Summer “[f]rom
The actual settlement of Brownington took a direct hit due to this weather anomaly in the early 1800’s. During the summer of 1816, a killing frost and snow cover killed nearly all the crops, save possibly any hearty planted Indian Corn which they were known to grow in that region.[7]
This relatively stagnant population suggests that the events in these years of 1812, 1815 and 1816 may have had a significant settlement impact in Brownington and its recovery in both population and viable agriculture production. However, by 1830 the population jumped, going from 265 in 1820 to 412 in 1830. It continued steady growth with only a minor reduction between 1870 to 1880, as did its agricultural production.[8]
|
|
|
Brownington |
1850 |
Census |
Totals |
|
2 |
Improved Land |
1675 |
1523 |
1800 |
4998 |
|
3 |
Unimproved Land |
2175 |
1502 |
2659 |
6336 |
|
4 |
Cash Value Farm |
36500 |
28650 |
33050 |
98200 |
|
5 |
Horses |
74 |
56 |
44 |
174 |
|
6 |
Asses & Mules |
0 |
0 |
0 |
0 |
|
7 |
Value Mach. Impl. |
1775 |
1415 |
1426 |
4616 |
|
8 |
Milk Cows |
27 |
65 |
107 |
199 |
|
9 |
Working Oxen |
20 |
24 |
62 |
106 |
|
10 |
Other Cattle |
133 |
180 |
126 |
439 |
|
11 |
Sheep |
502 |
409 |
430 |
1341 |
|
12 |
Swine |
33 |
17 |
40 |
90 |
|
13 |
Value Live Stock |
8772 |
7314 |
8212 |
24298 |
|
14 |
Wheat Bushels |
1226 |
1053 |
840 |
3119 |
|
15 |
|
0 |
0 |
0 |
0 |
|
16 |
Indian Corn, Bush. |
810 |
412 |
792 |
2014 |
|
17 |
Oats, Bushels |
2223 |
3527 |
3025 |
8775 |
|
18 |
Rice, Lbs. |
0 |
0 |
0 |
0 |
|
19 |
Tobacco, Lbs |
0 |
0 |
0 |
0 |
|
20 |
Ginned Cotton bales |
0 |
0 |
0 |
0 |
|
21 |
Wool, lbs |
2729 |
1512 |
1393 |
5634 |
|
22 |
Peas & Beans |
84 |
70 |
112 |
266 |
|
23 |
Irish Potatoes |
7335 |
4690 |
6010 |
18035 |
|
24 |
Sweet Potatoes |
0 |
0 |
0 |
0 |
|
25 |
Barley, Bushels |
144 |
125 |
345 |
614 |
|
26 |
Buckwheat bushels |
154 |
0 |
241 |
395 |
|
27 |
Value Orchard |
407 |
175 |
20 |
602 |
|
28 |
Wine, gallons |
0 |
0 |
0 |
0 |
|
29 |
Value, Produce |
0 |
0 |
0 |
0 |
|
30 |
Butter, lbs |
10600 |
4800 |
7380 |
22780 |
|
31 |
Cheese, lbs |
0 |
1050 |
100 |
1150 |
|
32 |
Hay, tons of |
826 |
444 |
901 |
2171 |
|
33 |
Clover Seed |
0 |
0 |
0 |
0 |
|
34 |
Other Grass Seed |
18 |
148 |
158 |
324 |
|
35 |
Hops, lbs |
0 |
0 |
0 |
0 |
|
36 |
Dew Rotted, tons |
0 |
0 |
0 |
0 |
|
37 |
Water Rotted, tons |
0 |
0 |
0 |
0 |
|
38 |
flax, lbs |
0 |
0 |
0 |
0 |
|
39 |
Flaxseed, lbs |
0 |
0 |
0 |
0 |
|
40 |
Silk Cocoons, lbs |
0 |
0 |
0 |
0 |
|
41 |
MAPLE SUGAR |
11650 |
8101 |
14265 |
34016 |
|
42 |
Cane Sugar |
0 |
0 |
0 |
0 |
|
43 |
Molasses |
0 |
0 |
0 |
0 |
|
44 |
Beeswax & Honey |
0 |
0 |
0 |
0 |
|
45 |
Value Homemade |
0 |
0 |
593 |
593 |
|
46 |
Value Anim. Slaugh. |
1046 |
868 |
1188 |
3102 |
Figure 7: Totals of Agricultural Census materials for Brownington’s
1850’s Agricultural Census, Calculated by author.
Most
farms in the 1850’s maintained larger flocks of sheep than herds of cattle. The
major industry in wool started with the introduction of 45 Merino sheep from
The
wool production in 1850 was recorded as with 5,634 pounds produced in the
census records for Brownington. The largest producer was S.J. Gillert’s herd of
25 sheep producing 350 pounds of wool, and his closest competitor, who produced
300 pounds with 15 sheep, was Mainey Humphrey.[13]
It is to note that “in 1840
Dairy production was also a substantial industry at the time, with a total count of butter produced being 22,780 pounds of butter and 1,150 tons of cheese. This year Joseph Anderson was noted as producing the largest amount of butter at 1,000 pounds with 11 milking cows in his herd.[15]
While Vermont is today known for its maple syrup, its maple sugar industry was booming long before the sweet syrup was the sought after element of a sugar maple. The 1850 agricultural yield for maple sugar was 34,016 pounds in total, with the largest producers being S.J. Gillert with 2,000 pounds and James Wheeler with 1,900 pounds produced.[16]
A decade later the 1860’s census follows up and further develops a similar scenario for agricultural production and continued diversity. There is a general chain of growth in almost all production areas for Brownington, noting a successful agricultural timeline with the focus still heavily on sheep.
This focus on sheep in 1860 can be seen as a total of 8,125 pounds of wool was produced in Brownington that year. Notable farmers in this production year were Mark Norris, who produced 600 pounds of wool with a large flock of sheep numbering 130, along with M. Trombly with 592 pounds of wool produced from his flock of 117 sheep, and finally Trimo Joslyn, whose flock of 114 sheep produced 447 pounds of wool.
Dairy production was a continually increasing agricultural activity as well, with 29,800 pounds of butter and 3,700 pounds being produced in total for cheese. This growth of the dairy production is evident in the census material; Ezra Grandall totaled 1,300 pounds of dairy products with 1,200 pounds of butter and 100 in cheese with eight milking cows in his herd.
This year for maple sugar was also a gain in overall sugar production with 37,968 pounds being produced. The highest productions were from Robert Alexander with 1,915 pounds of maple sugar produced, and L. English, a close second, who produced 1,900 pounds.
However, the most surprising element was the production of hops which had begun, with 5,450 pounds of hops produced in Brownington in 1860, noting a trend towards production of crop goods alongside hay, wheat, barley, and their major processed good, maple sugar. [17] The major producers of hops in 1860 were Francis Wills with 1,500 pounds of hops, L. Tinkham with 1,300 pounds, and finally 1,000 pounds from Philman Foster. However, this trend of large production would not last.
|
|
|
Brownington |
1860 |
Census |
Totals |
|
2 |
Improved
Land |
3522 |
2919 |
1059 |
7500 |
|
3 |
Unimproved
Land |
2820 |
1952 |
1046 |
5818 |
|
4 |
Cash
Value Farm |
65500 |
96650 |
33800 |
195950 |
|
5 |
Value
Machinery. |
3225 |
3670 |
1660 |
8555 |
|
6 |
Horses |
56 |
81 |
31 |
168 |
|
7 |
Asses
& Mules |
0 |
0 |
0 |
0 |
|
8 |
Milk
Cows |
104 |
89 |
64 |
257 |
|
9 |
Working
Oxen |
74 |
68 |
26 |
168 |
|
10 |
Other
Cattle |
136 |
155 |
43 |
334 |
|
11 |
Sheep |
452 |
1187 |
421 |
2060 |
|
12 |
Swine |
36 |
34 |
14 |
84 |
|
13 |
Value
Live Stock |
13865 |
20684 |
8309 |
42858 |
|
14 |
Wheat
Bushels |
578 |
812 |
353 |
1743 |
|
15 |
Rye,
Bushels |
263 |
80 |
33 |
376 |
|
16 |
Indian
Corn, Bush. |
118 |
602 |
190 |
910 |
|
17 |
Oats,
Bushels |
4700 |
7521 |
2210 |
14431 |
|
18 |
Rice,
Lbs. |
0 |
0 |
0 |
0 |
|
19 |
Tobacco,
Lbs |
0 |
0 |
0 |
0 |
|
20 |
Ginned
Cotton bales |
0 |
0 |
0 |
0 |
|
21 |
Wool,
lbs |
1520 |
4894 |
1711 |
8125 |
|
22 |
Peas
& Beans |
5 |
0 |
4 |
9 |
|
23 |
Irish
Potatoes |
1250 |
8860 |
3250 |
13360 |
|
24 |
Sweet
Potatoes |
0 |
0 |
0 |
0 |
|
25 |
Barley,
Bushels |
531 |
272 |
299 |
1102 |
|
26 |
Buckwheat
bushels |
503 |
336 |
182 |
1021 |
|
27 |
Value
Orchard |
0 |
0 |
0 |
0 |
|
28 |
Wine,
gallons |
0 |
0 |
0 |
0 |
|
29 |
Value,
Produce |
0 |
0 |
0 |
0 |
|
30 |
Butter,
lbs |
8200 |
14500 |
7100 |
29800 |
|
31 |
Cheese,
lbs |
200 |
2000 |
1500 |
3700 |
|
32 |
Hay,
tons of |
850 |
1073 |
370 |
2293 |
|
33 |
Clover
Seed |
320 |
20 |
0 |
340 |
|
34 |
Other
Grass Seed |
274 |
175 |
0 |
449 |
|
35 |
Hops,
lbs |
2650 |
1500 |
1300 |
5450 |
|
36 |
Dew
Rotted, tons |
0 |
0 |
0 |
0 |
|
37 |
Water
Rotted, tons |
0 |
0 |
0 |
0 |
|
38 |
Flax,
lbs |
0 |
0 |
0 |
0 |
|
39 |
Flaxseed,
lbs |
0 |
0 |
0 |
0 |
|
40 |
Silk
Cocoons, lbs |
0 |
0 |
0 |
0 |
|
41 |
MAPLE
SUGAR |
12562 |
19006 |
6400 |
37968 |
|
42 |
Cane
Sugar |
0 |
0 |
0 |
0 |
|
43 |
Molasses |
0 |
0 |
0 |
0 |
|
44 |
Beeswax
& Honey |
0 |
260 Honey |
40 Honey |
300 Honey |
|
45 |
Value
Homemade |
235 |
290 |
95 |
620 |
|
46 |
Value
Anim. Slaugh. |
1672 |
1927 |
815 |
4414 |
Figure 8: Totals of Agricultural Census materials for Brownington’s
1860’s Agricultural Census, calculated by author.
According to further research the trend in hop growth is noted in the following book Vermont: It’s Resources and Opportunities by Walter Hill Crockett:
At one time hop
growing was an industry of considerable importance in
As stated, by the 1880’s the trend in growing hops had begun to decline with only 3,311 pounds of hops, in total, being produced by six farmers. The only farmer with a large crop yield was George W. Jillson with 1,300 pounds of hops derived from two acres. Most other farmers who raised hops produced in the low two hundred pound range. However, this was not the only crop in 1880 to move downward in growth.
Wool was also set on a downward trend, after long being the main element of agriculture in Brownington. The top producer was Silas Bartlett, he produced 400 pounds of wool out of a flock of 90 sheep, although he was an anomaly. The census records make note that many producers were within merely a 200 pound range with only an average flock size of 30. Here the slow trend downward for the Merino sheep makes itself apparent through the census. And so, the slow move away from these goods leaded to the further emphasis on other elements of farming.
While maple sugar production did not decrease, its producers in 1880 seemed to produce less as individuals in this year. Simply, its production by producer was not as large as it had been nearly 10-40 years prior. However, many producers came out with at least 1,000 pounds of maple sugar, while several others kept their production over 1,500 pounds. The largest producer was John G. Taiff, who produced 1,800 pounds of maple sugar. This also supports the conclusion that in 1880 the growth of farms meant more farmers, but less land and less individual production.
The
silver lining in what was a gloomy census year is through the production of
dairy, which shows a large production growth, with herd and dairy production
more than doubling. Dairy production showcased large growth in 1880 probably
due to new technologies being applied to farming, such as refrigeration. The largest
producers were Herbert H. Troley, whose farm produced 2,600 pounds of butter
and 200 pounds of cheese out of fifteen milking cows while S. Tinkham, with a
herd size of 17 milking cows, on what is today the
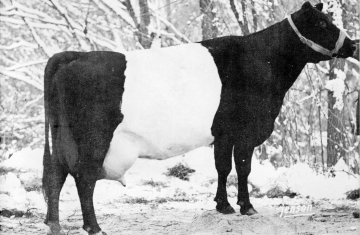
Figure 9:
Courtesy of the Univesity of
The striking difference in 1880 is the fact that, with the growth of farmers, individual production itself was not at an increase. This supports a conclusion to the fact that, while farms and farmers in number were growing, their farm size and individual production was noticeably shrinking while overall production continues to meet the Vermont State Agricultural trends as expected.
It is notable that the census format at this period for 1880 had also changed; suggesting that farming, as a business, was undergoing various changes on a larger level and the census was adapting to identify more relevant information regarding farming. An example of these include the following: assessment of ownership; further breakdown of acreage usage and usability; fencing information and costs; fertilizer costs; labor costs; further estimations of all products from the farms; a more in depth look at animals; and a larger emphasis on forest production.[19], [20]
Today,
current elements of Brownington are being used to portray the local history.
The
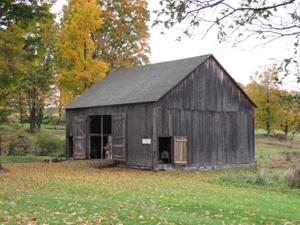
Figure 10:
Overall,
Brownington followed, with a slight lag, the trends of
Ongoing research will ultimately yield an even clearer picture into the rural life, agricultural events, and undertakings of those that have lived in Brownington, especially with the help and guidance of its residence and volunteers. The gaps that need filling include a more detailed look into still standing properties, a clearer expansion of the events that lead Brownington’s agricultural production to both conclusion and continued progress. The combined help of locals alongside scholarly vetted research holds the capacity for even further questions and answers about Brownington’s agricultural past.