The Vermont Vineyard Viewer allows viticulturists and prospective grape growers to view maps of climatic, topographic, and soil characteristics that are important in evaluating suitability of sites for new grape plantings. The web mapping application also shows locations of existing vineyards and wineries. The Vermont Vineyard Viewer was developed by the University of Vermont's Spatial Analysis Laboratory for the Vermont Grape and Wine Council with funding from the State of Vermont.
This map viewer can guide efforts to identify and delineate desirable vineyard sites but is not a complete tool for doing so. At specific site-level locations, values of mapped variables have typically not been measured directly but are estimates derived from the closest available measurements. The Vermont Vineyard Viewer is one starting point for site evaluation and should be augmented with field data acquired from on-the-ground site visits. Soil tests and consultation with local experts are strongly recommended before committing to the expense of developing a new vineyard site.
We gratefully acknowledge the following organizations and individuals who contributed data, insight, and inspiration for the Vermont Vineyard Viewer: Dr. Alan Lakso and The Institute for the Application of Geospatial Technology, whose NY Vineyard Site Evaluation System was a model for the Vermont Vineyard Viewer; Dr. Art DeGaetano of the Northeast Regional Climate Center; Martha Stuart, USDA Natural Resources Conservation Service, Vermont office (USDA-NRCS); and the Vermont Grape and Wine Council. The Vermont Vineyard Viewer was built using OpenLayers — an open source Javascript library.
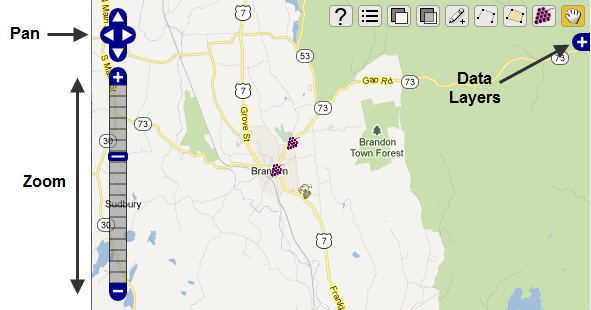
Move around the map (pan) by clicking and dragging on the map or by using the arrow buttons in the upper left corner of the interface. Change the scale (zoom in) by double-clicking on the map, by using the scroll wheel on your mouse (if you have one), or by using the navigation controls (upper left). Control buttons in the upper right are described below.
Access a list of data layers and turn them off or on by clicking the plus-sign ("+") in the upper right corner. Hide this control panel by clicking the same button, which changes to a minus sign ("-") when open.
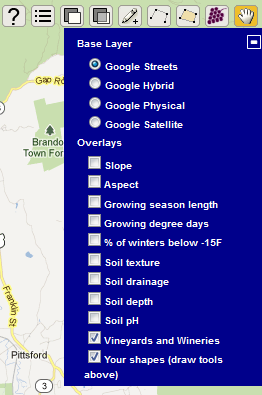 Base Layers are the geographic information (basemap) always visible in the background. Site evaluation variables are Overlays, as are existing vineyard/winery locations (Vermont Wine & Vine Trail), and any temporary vector objects that you create. One, and only one, Base Layer will be visible at any time. Multiple overlays can be viewed together, although it can be confusing to view more than one variable at a time.
Toolbar buttons shown in the following figure are numbered left-to-right with corresponding functional descriptions listed below.
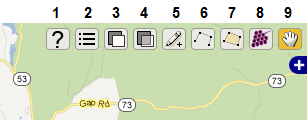
Note about marking locations: Control buttons 5 through 7 can be used to create vector objects (points, lines, and polygons). These features are temporary but persist until the browser session is refreshed.
Vermont Wine & Vine Trail locations are indicated using fruit symbols created for VGWC. Click on button 8 and then retrieve information (name, address...) about a particular vineyard or winery by clicking on the appropriate symbol.
Climate map layers presented for vineyard site evaluation were produced by the Northeast Regional Climate Center with climate models that use elevation and topography to estimate temperature from data collected at weather recording stations throughout the region. These models estimate temperature on a 5km x 5km grid using data collected from 1980 to 2007. The resulting temperatures were used to generate 3 climatic variables thought to be of greatest concern for viticulture: growing season length, warmth of growing season, and severity of winter cold.
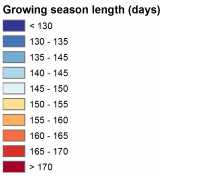 Growing season length is the average number of days between the last Spring date and the first Fall date when temperature dropped to 28°F. This threshhold is the temperature at which plant tissue freezes. Season lengths above 180 days are considered good, and 160 days is thought to be a minimum acceptable value.
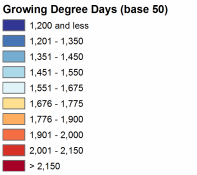 One useful expression of growing sseason warmth is Growing Degree Days (GDD), which is an index that integrates temperature (above a threshhold of 50°F necessary for vine growth) and time. GDD is calculated using daily temperature extrema by summing the difference between the average temperature and 50°F for all days in the period April 1 to October 31. Note that GDD is only one of several possible methods of approximately quantifying growing season warmth. The actual value of GDD for a particular area might not be as enlightening as relative values across the region, particularly given the warming trend (and increase in GDD values) observed in recent years.
 Severity of winter cold is expressed as the percentage of winters that fall below a critical threshhold. In Vermont, the climate is generally cold enough relative to other grape-growing areas of the Northeast that winter temperatures regularly fall below most of the critical threshholds for vinifera and moderately hardy hybrids (0°F, -5°F, -10°F). The relevant threshhold for Vermont is -15°F, and the corresponding map layer used here indicates the percentage of winters from 1980-2007 that had minimum temperatures below -15°F.
Map layers of topographic variables were acquired from the Vermont Center for Geographic Information (VCGI) and are based on 30-meter Digital Elevation Models.
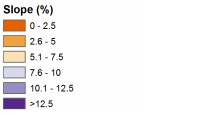 Slope is important to vineyard site suitability insofar as it affects soil erodability and movement of air and water. Flat or gently sloped sites are better in terms of soil erosion but might be problematic if water drainage is inadequate or if local depressions can develop cold air inversions. Steeper sites may have better water and air drainage but can be problematic if slope steepness makes operating equipment difficult or unsafe.
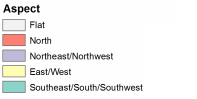 The direction a slope faces can sometimes be an important topographic consideration in hilly areas where North-facing slopes might not receive sufficient sun. Aspect is generally not as important as temperature or soil characteristics.
Soil characteristics that can affect vine growth include texture, drainage, depth, and pH. Map layers of these characteristics were developed using USDA-NRCS digital soil polygons available from VCGI, and additional attributes acquired directly from USDA-NRCS. Mapped soil polygons are a general indication of the natural soil in an area. As with temperature-related variables, actual soil characteristics of specific sites should be verified using measurements acquired from a site visit. Prospective growers are strongly recommended to collect soil samples and dig soil pits to determine soil characteristics. Note that digital data for Essex County were not available at the time of this project.
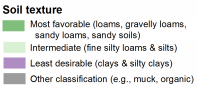 Soil texture was classified according to the primary parent materials of the major components of the soil type. Silts and fine silty loams are satisfactory (and my be improved with appropriate treatments); loams and sandy soils are preferred; clays and silty clays are generally unsuitable.
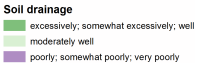 Soil drainage is important for root aeration. Poor drainage may possibly be improved to an acceptable level by using drainage tiles. Drainage classes used here are as categorized by USDA-NRCS.
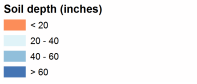 The soil depth layer indicates depth to bedrock as expressed by the USDA-NRCS classification. Depth of 20 inches or more is considered to be acceptable. Deeper soils are generally better.
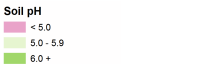 Soil pH is an expression of soil acidity and is important because it affects mineral nutrient availability. Lower values are more acidic; higher values are more alkaline. Neutral values are considered optimal. The classification used here reflects value ranges recorded by USDA-NRCS and may not match value ranges quantified as having particular benefits or risks with respect to viticulture.