More complex Mendelian crosses
Tri-hybrid cross
e.g.
Smooth, Yellow seed, Purple flower
X
wrinkled green seed, white flower
(SSYYPP x ssyypp)
What are the phenotypic ratios in the F2?
Construct a branch diagram as we did in class to find
the phenotypic ratios.
(hint: Look at each trait separately, then multiply
the probabilities)
Your book shows this same cross in Fig. 10.14
Question
Compare the expected F2 phenotypes in these two
crosses:
AABB x aabb
vs
AAbb x aaBB
We did this briefly in class- convince yourself that
both of these give the same 9:3:3:1 phenotypic ratios in the
F2.
Pedigree Analysis
We drew one of Mendel's crosses as a (simple)
pedigree
PP x pp
Pedigree Analysis
Here are some general patterns:
Recessive mutant alleles
Observe normal, heterozygous parents of affected
individuals
Phenotypes often "skip" generations
matings between normal carriers should produce 25% affected
offspring
Dominant mutant alleles
every affected person has at least one affected
parent
trait does not usually "skip"
generations
on average, an affected person has 50% affected
offspring
Fig. 10.16 shows symbols used in human pedigree
analysis-for our purposes we really just need to know male vs
female, parent-offspring, and affected/unaffected.
The story of baby Pierre
(from a collection of "case studies in biology", based
on an article in Natural History by Jared Diamond , I
think)
Born March 7, 1964, but "failed to thrive"; died
November 30
(gained only 1/2 pound in 6 months, urine "smelled like
rotten cabbage")
Turns out other similar children were also born in that small
village (Chicoutimi area of northern Quebec). Occurred in both
boys and girls. In families with one affected child, about 1/4 of
children showed the condition.
Is it a genetic disorder? Why?
How could you distinguish this from an environmental
pollutant or from an infectious disease that happens to be common
in this area?
Here is the pedigree:
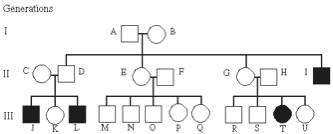
Is the condition dominant or
recessive?
What is the genotype of T? of C?
Another problem:
If K marries her cousin M, what is the probability that they
will have a normal child?
This one was a bit more complex, and we had to make
the additional assumption that individual F was not a carrier. Can
you repeat that analysis on your own?
Analysis of real data
The expected Mendelian ratios are predictions, but they are
rarely observed exactly in real data. How can you tell if the
observed data still fit your model?
Real Data from Mendel's paper
Table 10.1
F2 ratios
Smooth vs wrinkled 5474:1850 = 2.96:1
Purple vs white 705:244 =
3.15:1
How do you tell if it really fits the 3:1 model?
Chi square goodness of fit test:
Use for experiments where you COUNT something and want to test
the fit to a prediction.
("X2" is the symbol we use for
"chi-square".)
X2 =SUM of (observed - expected)
2
(expected)
(add up all of the squared deviations from the
expected value)
Things to keep in mind:
Use counts, not percentages
Compare your value to critical values in Table 10.5
If your observed value is too large, the fit is worse than
expected by chance.
Degrees of freedom
Usually n-1, where n is the number of phenotypic
classes
Simple example:
Observe Expect difference
(O-E)2/E
Purple 20 18 2
4/18
White 4 6 2
4/6
X 2= 0.88
Observe Expect difference
(O-E)2/E
Purple 10 18 8 64/18
White 14 6 8 64/6
X 2= 14.11
Here is another probability question to practice on
:
Mendel crossed smooth (S) and wrinkled (s) peas to produce an F1
(which were all smooth). He then selfed the F1 plants to make an
F2, which contained both smooth and wrinkled peas.
What is the proportion of smooth plants expected in the
F2?
If all of those smooth F2 were crossed to smooth F1 plants, what
is the expected proportion of wrinkled peas in the next
generation?
Chapter 10 Problems
2, 3, 4, 9, 10, 11, 13, 15, 18, 23, 25, 26, 30
You can always find these problem assignments on the course web
page, too