|
Having the multiple sectors of the community involved with the collaboration is essential to the
legitimacy of your collaboration and its overall success. This exercise is designed to be a self
assessment tool for collaborations regarding their membership. Membership in a collaboration
can be directly participating in the collaboration’s meeting and events or it can mean contributing
to the collaboration through donations. For example, a local radio station, might donate air time
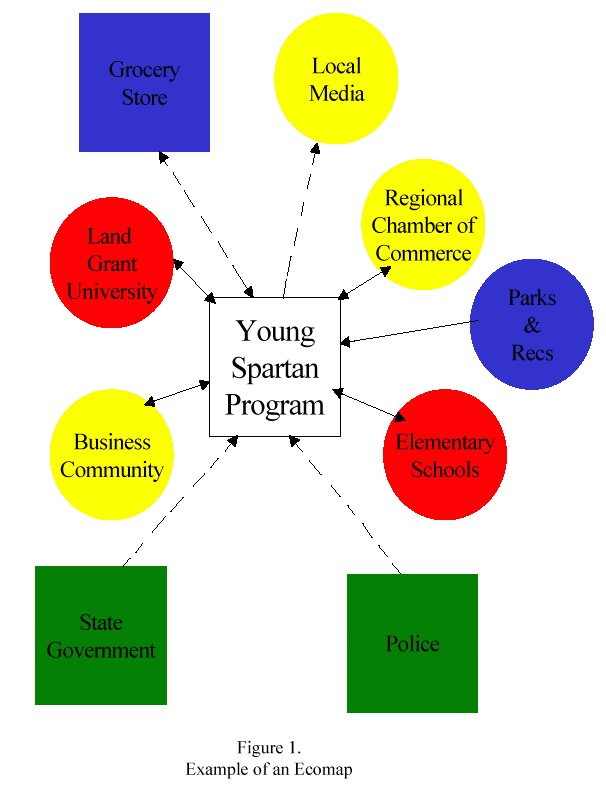
to advertise your event. An ecomap is a way to visually represent components of the community
in relation to a collaboration and its members. Creating an ecomap allows collaboration members
to identify gaps in their membership of the collaboration.
Purpose:
- To identify current members of a collaboration.
- To identify current members and organization roles in the collaboration.
Materials:
- "All Over the Map" handout, one per participant
- Overhead of Figure 1 (ecomap example)
- Newsprint for all the individuals and one for the overall collaboration ecomap
- Pen or pencil
- Markers or colored pencils
Procedure:
- Explain to the participants that they are going draw an ecomap. (2 minutes)
- You may want to say to the participants, “Today we are going to draw an ecomap.
An ecomap is picture that provides graphic information about the direct and
indirect involvement of various community organizations and citizen groups
involved in your collaboration. Simply, it is a picture of who is involved in your
collaboration.”
- You may want to show them an example of an ecomap (see Figure 1)
- Distribute the handout with "All Over the Map" instructions. Go through each of the
steps to be sure participants understand the directions, as follows:
- Draw your group in the center of the page.
- In the next layer, put those agencies, organizations, and people who are in direct
contact with the group. In addition include the role that they play in the group.
This layer can include the organizations that members are representing.
- In the outermost layer, put those organizations and businesses who are indirectly
involved in your group (e.g., donors, corporations, local business, media)
- An ecomap can be used to show how groups are related to each other. Use
different colors, shapes, and lines to show these relationships for your community.
- 1. Use shapes to indicate member’s reason for being involved
- -Circle used for members who are mandated to be involved in the group.
- -Squared used for members who are voluntary involved in the group.
- 2. Use lines to indicate the level of the connection
- -Use a solid line to indicate a strong relationship
- -Use a dotted line to indicate a relationship that is unsure.
- -Use arrows to show the direction of relationship - is it one-way or two-way.
- 3. Use colors to indicate the level of involvement in your group.
- -RED: Greatest degree of involvement
- -YELLOW: Moderate degree of involvement
- -BLUE: Sporadic degree of involvement
- -GREEN: Low degree of involvement
- Have individuals complete this exercise by themselves. (8-10 minutes)
- Then have them get into groups of five member and complete an overall collaboration ecomap. (10 minutes )
- Bring the smaller groups together and facilitate the creation of the overall collaboration ecomap by reviewing the small groups’ ecomaps. (10 minutes)
|
|


