Economics 172
Spring 2006
Due Friday March 3
Chapter 6: Questions: 2, 5, 8, 10, 12,
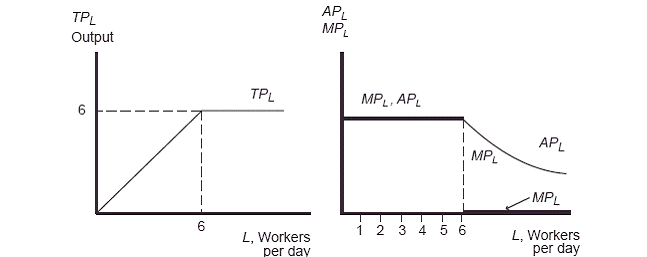
2. In the first graph, total output increases
with the addition of L, so the total product curve is upward sloping wth a
slope of 45 degrees. When 6 workers are
hired, 6 units of output are produced.
But then each additional worker produces 0 output
so the TP line is horizontal. In the
second graph, the AP and MP curves are drawn.
AP and MP are both equal to 1 as each
additional unit of labor is hired. But
the seventh worker has an MPL of 0. That
brings the APL down to something less than 1.
The 8th worker and everyone after that also has an MPL of 0, so the APL continues to fall and is
asymptotic to the x axis.
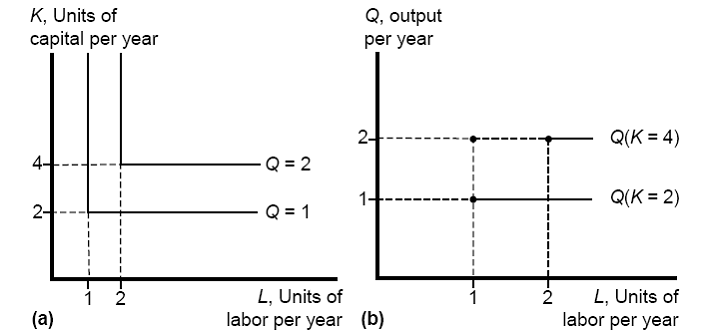
5. This fixed proportion production function has
L shaped isoquants. No matter how many
more workers we use, if capital is fixed, there is no more outpu possible. The graph of the production function looks
like a.
For the total
product curve, start with 2 units of capital and 1 unit of labor. That makes total output equal to 1. If we hold K constant at 2 and increase L to
2, total output is still 2. So the total
product curve is a horizontal line at the level of output chosen and it starts
at L=1. If we increase K, the total
product curve is also horizontal, but it is at a higher level of output and it
begins at L=2.
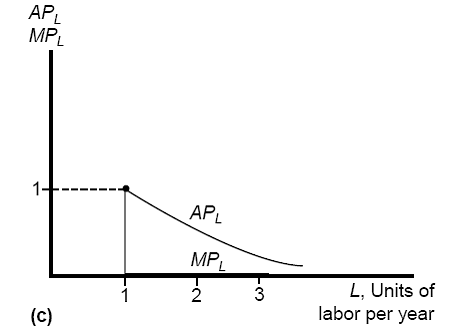
The marginal
product curve looks like the following.
The marginal product of labor for the first worker hired, for the
production function where Q=1, is 1.
With any additional workers, the MPL is 0, just like the previous
question. And for the same reason, the APL
slopes downward and is asymptotic to the L axis.
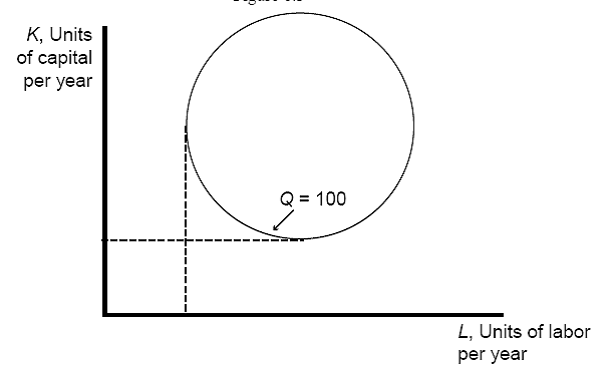
8. The isoquant for Q=100 will be the quarter
of the circle to the southwest, that is the convex part. That is the only efficient part of the
circle.
10. Diminishing marginal returns is a short run
phenomenon caused by the existence of a fixed factor of production. Constant returns to scale is a long run issue
where all inputs are variable. Figure
6.5 shows the returns to scale in the long run.
Since isoquants are convex, this means that in the short run, there is diminishing
marginal returns to each factor.
12. If US firms lay off workers, the remaining
workers have a higher APL. Since the
Japanese firms always have the same number of workers, when their output falls
their APL falls as well.
Think of it this
way, here are 10 years worth of production for the
|
Year |
Output |
|
Japanese L |
|
J APL |
|
|
|
|
|
|
|
|
1 |
100 |
10 |
10 |
10.0 |
10.0 |
|
2 |
90 |
9 |
10 |
10.0 |
9.0 |
|
3 |
90 |
9 |
10 |
10.0 |
9.0 |
|
4 |
100 |
10 |
10 |
10.0 |
10.0 |
|
5 |
90 |
9 |
10 |
10.0 |
9.0 |
|
6 |
90 |
9 |
10 |
10.0 |
9.0 |
|
7 |
90 |
9 |
10 |
10.0 |
9.0 |
|
8 |
100 |
10 |
10 |
10.0 |
10.0 |
|
9 |
100 |
10 |
10 |
10.0 |
10.0 |
|
10 |
90 |
9 |
10 |
10.0 |
9.0 |
|
|
|
|
|
|
|
|
|
|
|
Avg 10
Years |
10.0 |
9.4 |
|
|
|
|
|
|
|
Note that the
answer in the text is different because Perloff says it depends on what happens
during expansions. My assumption is that
the increase in labor inputs is proportional to the increase in output.
1. You are given the
following information about a company that uses a fixed amount of trucks and a
variable number of workers to deliver refrigerators in
|
Number of Trucks |
Amount of Labor |
Total Output |
APL |
MPL |
|
2 |
0 |
0 |
-- |
-- |
|
2 |
1 |
75 |
75 |
75 |
|
2 |
2 |
200 |
100 |
125 |
|
2 |
3 |
300 |
100 |
100 |
|
2 |
4 |
380 |
95 |
80 |
|
2 |
5 |
430 |
86 |
50 |
|
2 |
6 |
450 |
75 |
20 |
2. In 1965 Gordon
Morre, the cofounder of Intel, predicted that the number of transistors per
square inch on integrated circuits, and thus the computing speed of a given
size microprocessing chip, would ocntinue to double every year for the
forseeable future. In subsequent years
the pace has slowed down a bit, but data density has approximately doubled every
18 months. This is the current
definition of
a.
Does
No it does
not. The law of diminishing marginal
returns says that, in this case, computing speed would eventually decrease if
there was a fixed input and more variable inputs were applied to it. But if all inputs are variable, which they
have been in this case, you can get more and more output (speed) from the
computing chip.
b. Using the internet to find the answer, tell me how many transistors can be placed on an integrated circuit.
According to an
article in wikipedia (http://en.wikipedia.org/wiki/Computer_chip)
today you can put 1 million transistors on a chip of 1 square millimeter. Computer chips can be up to 100 square
millimeters, which means about 100 million transistors on a chip.
Courtesy of http://www.kurzweilai.net/meme/frame.html?main=/articles/art0277.html
(thanks to Gwen Pokalo for bringing this website to me).
Year Transistors in Intel's Latest Computer Chip
1972 3,500
197 46,000
197 829,000
1982 134,000
1985 275,000
1989 1,200,000
1993 3,100,000
1995 5,500,000
1997 7,500,000
*****************************************
Here’s an old exam question from the consumer theory section of the course that is a good application to public policy issues. It’s a good review for the final…..I won’t give you the answer.
This problem
is based on a real incident, although the numbers have been changed slightly. The Town of
a. Draw the
initial budget line and indifference curve and equilibrium situation for a
representative Perkasian with trash disposal as one good and the compositive
good as the other.
In an attempt
to reduce the volume of trash, the town decided to require people to buy trash
bags; the only trash that haulers would pick up would be trash placed in these
bags. The bags cost $1.50 each and the
price was set such that the average household would use 80 bags per year and
generate the same amount of trash for the same costs as before the new
program. The town eliminated its $120
annual trash collection fee, so the only cost of trash disposal was $1.50 per
bag. (Assume that a bag of trash holds
exactly 25 pounds of trash; 25 pounds x 80 bags = 2,000 pounds of trash per
household.)
b. Draw the new budget line,
indifference curve, and equilibrium situation for a representative Perkasian
household after the new policy was put into effect and show how it is possible
that one Perkasian household could generate the same volume of trash as before.
c. In
reality, the total volume of trash generated by Perkasians was reduced as a
result of the new program. Show how an
average Perkasian household could reduce its volume of trash and be made
better off as a result of the new policy.
Redraw your graph from part a and draw the new budget line, indifference
curve, and equilibrium situation for this representative Perkasian household
that did reduce the volume of trash that it disposed of and achieved a higher
level of utility. Briefly explain and
compare this to your results from part a.
d. What would happen to the annual cost of
trash disposal to this representative household you described in part c? Explain.
(Note that the actual total trash disposal costs did decline in Perkasie
after this program was implemented.)