
Click the link below and save the following JMP file to your Desktop:
Unemployment Rates by State 2000
Now go to your Desktop and double click on the JMP file you just downloaded.
This action will start JMP and display the content of this file:
Go to the Analyze menu and select Distribution:

You will see the following dialog box:

Click the Percent column , then click the Y, Columns box:

Click OK:
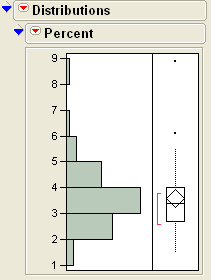
Click on the red down arrow next to Percent, select Display Option, then Horizontal Layout:

You should see the following:

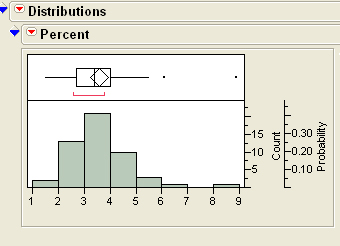
Click once again on the red arrow next to Percent, select Histogram Options, then Count Axis:

You should see the following:

You can also add relative frequency to the y-axis.
Click the red arrow next to Percent, select Histogram Options,
then Prob Axis.
You should see the following:
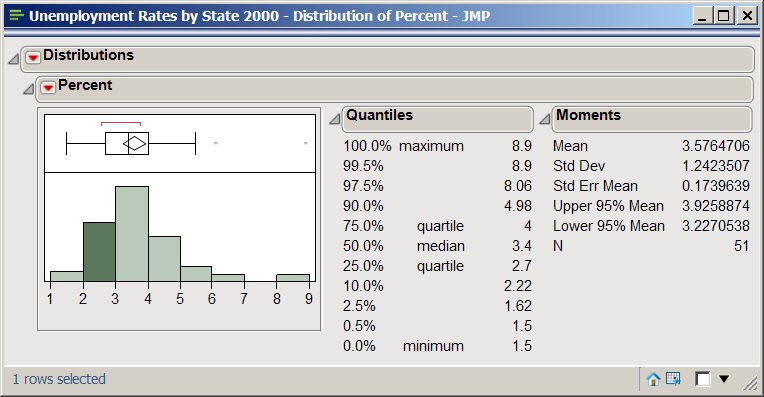
If you don't want both the count axis and the relative frequency axis displayed, uncheck the Count Axis option (red arrow, Histogram Options, Count Axis):

Changing the Number of Bins and Class Boundaries & Copying a figure into Word
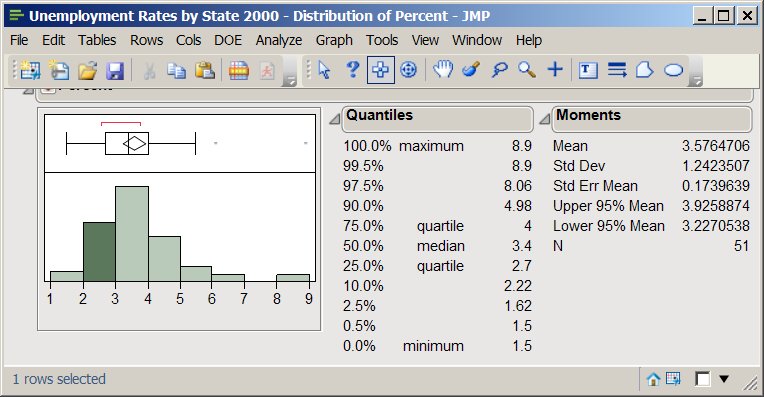
Go to the Tools menu and select the Grabber tool:
NOTE: the Tools menu may be hidden in the plot window. If so, you can reveal it by clicking on the light blue/gray bar just above the red triangle that says "Distributions".

Place the Grabber cursor on top of the histogram bars and click and
drag - up and down and side to side - to see the histogram change
class boundaries.
As an example, using this method, you can produce the following
histogram:

If you plan to continue using JMP, go to the Tools menu and select the default Arrow tool:
Copying a figure into Word
Go to the Tools menu and choose the Selection tool:
Highlight (by clicking and dragging) the figure (or portion of the figure) that you want with the selection tool and hit control-C (or File:Copy).You can then paste into Word using control-V (or Paste).
If you plan to continue using JMP, go to the Tools menu and select the default Arrow tool:
