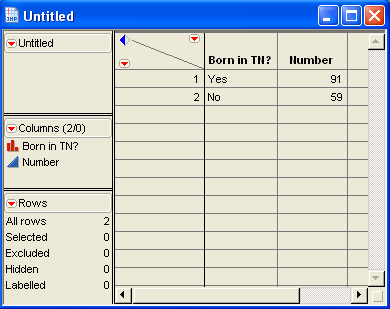
A random sample of n=150 Stat 201 students in Spring 09 revealed that 91 of them were born in Tennessee.
Create a JMP data table as follows. Notice that 91 + 59 = 150 = sample size.
Go to the Analyze menu and select Distribution:

Click the column Born in TN? and then click Y, Columns.
Click the column Number and then click Freq.
You Should see:
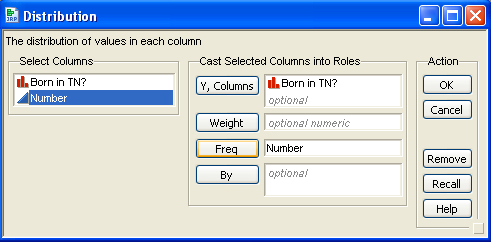
Click OK.
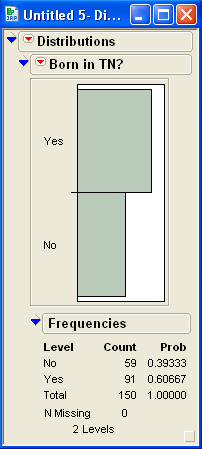
This will produce the following:
To create 95% confidence intervals, click on the red down arrow next to Born in TN? and select Confidence Interval, then 0.95.
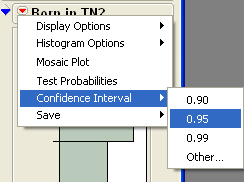
You should see the following additional output:

Hypothesis Testing
Click the red down arrow next to Born in TN? and select Test Probabilities.

Suppose, prior to collection the data, someone thought that 50% of all Stat 201 students in Spring 09 were born in Tennessee. You disagree, but you are not sure if it is above or below 50% (i.e., a 2-sided alternative hypothesis).
Fill in the resulting dialog box as follows:

Click Done:
You should see the following output:
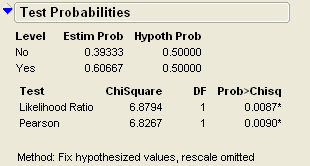
Notice that the Pearson p-value above is 0.009, and will match the p-value obtained using the z test statistic approach. In this case, for a 2-sided alternative, JMP uses the square of the z test statistic, called the Chi Square test Statistic. The two method are mathematically identical.
Note: If your data are "unaggregated", such as 150 rows of the following:
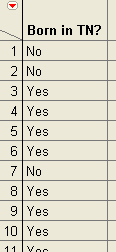
all the above instructions apply, except you place nothing in the Freq text box, like this:
