Forest Phenology
Field Assessments of Sugar Maple Phenological Events
The timing of seasonal plant events, including springtime leaf expansion and fall senescence, has important implications for ecosystem processes. Long-term field assessments of tree phenology allow us to understand how changes in climate are impacting forested ecosystem. Subtle changes in the timing and duration of phenology may have widespread consequences throughout forest ecosystems. Current VMC data sets include visual assessments from 1991 to present of sugar maple (Acer saccharum Marsh.) bud break and fall senescence at two elevations on the western slopes of Mount Mansfield in the Green Mountains of Vermont.
The Data
Annual phenology assessments for sugar maple started each spring while buds were dormant and continued to full leaf expansion. Spring phenology was assessed twice weekly on five dominant sugar maple at the Proctor Maple Research Center, at an elevation of 415 m (1400 feet). At each date, ten tree buds per tree were assigned to one of 8 bud developmental stages (Skinner and Parker 1994). Average daily phenological stage was calculated from the mean of the five trees assessed.
Metrics of fall phenology included visual ratings of percent color and leaf drop, Maple recorded weekly beginning in September on the same trees at the Proctor Maple Research Center. Additional sugar maple trees were also monitored at a site above the Underhill State Park at an elevation of 670 m (2200 feet). Percent color was assessed as the proportion of the current leaves exhibiting a color other than green. Percent leaf drop was estimated as the proportion of potential leaves missing. While these are subjective visual estimates, at important stages, such as full color or full leaf drop, the estimates are most reliable. After field data are collected, color estimates were recalculated as the proportion of initial fully foliated crown with color (actual color):
Actual color (%) = 100×((Percent field color)/100 – ((Percent field color)/100 × (Percent leaf drop)/100 ))
The date of leaf drop can vary depending on weather events (e.g. rain and wind) and not necessarily when tree senescence begins. Our indicator dates of fall senescence were based on when trees had foliage that was all colored or dropped.
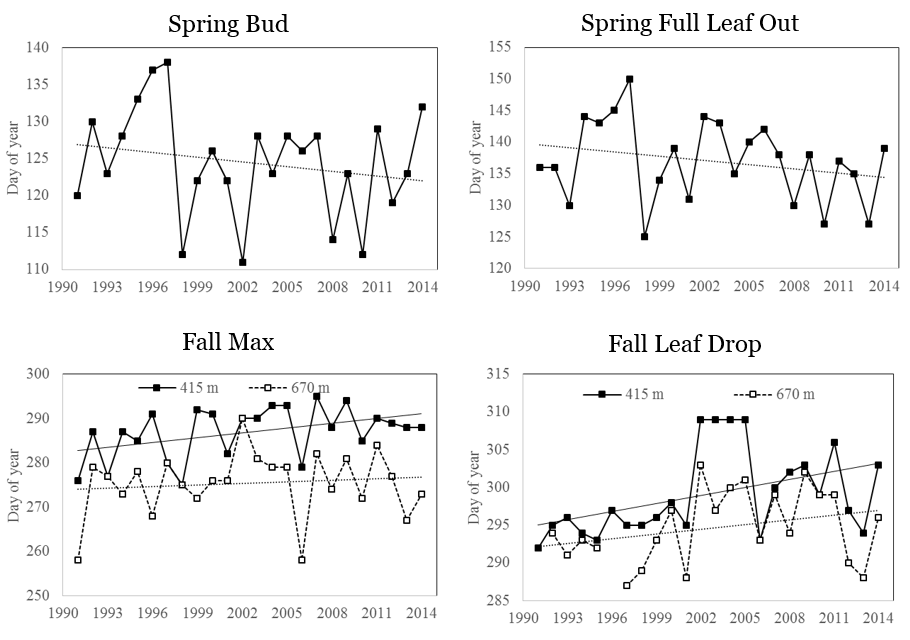
Temporal trends in spring phenology were assessed by examining the dates of two significant phenological events across 23 years of data: (1) first day of year (DOY) of bud break (phenological stage 4); and (2) first day of year of full leaf expansion (phenological stage 8).
Fall phenology was similarly examined by comparing the timing of two significant fall phenological events across time: (1) the day of year (DOY) with maximum fall color observed in the canopy; and (2) the day of year (DOY) on which all tree's leaves had either colored or fallen from the canopy. Yearly anomalies for all phenological events were calculated by comparing each year's data to the mean value for the entire measurement period. Linear regression was performed to assess the change in timing of each seasonal developmental event across the 23 year period.
2014 in Summary
The day of year of first bud break in 2014 for sugar maple (DOY 132) was considerably later than the long-term average (DOY 124). Green-up was more rapid than the long-term average of about 12 days – in 2014, there was just one week between bud break and full leaf-out. At lower elevation, maximum fall color occurred at the same time as in 2013, but full leaf drop came 9 days later than last year and nearly 4 days later than the long-term mean. At higher elevation both stages occurred later than last year and closer to the long term means, with fall color 2.3 days earlier and leaf drop 1 day later than the long-term means.
Long Term Trends
While 2014 was consistent with the long-term mean, a trend toward an earlier start of spring was observed in the long term dataset as evidenced by both earlier bud break and earlier full leaf expansion dates. The changes in fall development similarly showed trends which would lengthen the growing season by delaying fall senescence. The timing of maximum fall leaf drop had the strongest and most statistically significant response of all the phenological variables considered in this study, with an almost 9 day delay over the 23 year record at the lower elevation site.
High variability in our spring phenology data is likely the result of our low sample size (n=5) for each year. As such, it is difficult to make statistical inferences for bud burst (p = 0.34) or leaf out (p = 0.25). Nevertheless, there does appear to be a weak trend for earlier spring phenological measures since the beginning of our monitoring efforts (Figure 1). Significant trends towards later fall color and leaf drop at lower elevations continue to be observed. The delay of maximum fall colors at low elevations showed significantly later peak foliage over time (p = 0.03), culminating in an average delay of 8.4 days across the data record. Fall leaf drop similarly had a statistically significant delay (p= 0.03) with a cumulative 8.2 day delay in drop at low elevation. Trees at upper elevation, on the other hand, did not show a trend of changing fall phenology for either of the fall metrics.
These trends toward earlier springs and later falls are consistent with trends reported in earlier analyses of the VMC data set (see https://www.uvm.edu/femc/reports/SugarMapleSpringPhenology_Mansfield2010.pdf)
Implications
There is mounting global evidence for trends of changing vegetation phenology, including earlier spring leaf out and later leaf senescence in the fall. As found in the 2013 data, analysis of 2014 and the long-term trend continues to indicate that phenology of sugar maple trees may be changing in accordance with globally observed patterns. Once again, changes in fall phenology were not observed in sugar maples growing at upper elevations, which continues to be surprising given model data suggesting that warming due to climate would be more extreme at higher elevations (Giorgi et al. 1997), however these documented models relied on winter temperature cues. Exploring microclimatic differences at each elevation are necessary to tease apart the possible mechanisms behind differing phenological responses of trees at the two sites.
The changes we observed in the timing of foliar development carries important economic repercussions for Vermont's maple syrup and tourist industries. Vermont is the largest producer of maple syrup in the United States, accounting for 41% of the country's production and earning 50 million dollars in 2011 (Sawyer et al. 2013). Tapping schedules are generally determined by tradition (Frumhoff et al. 2007), but warmer winters and earlier springs are now shortening and advancing the sugaring season (Skinner et al. 2010). Maple syrup producers will need to employ new management techniques for the industry to adapt to the changing climate (Frumhoff et al. 2007, Skinner et al. 2010). Similarly, these changes are relevant to the state's tourism industry which relies on leaf peeping tourists in autumn. The tourism industry may include altered schedules and expectations for peak foliage.
These results carry implications for water cycling in forests, as earlier springs may escalate evapotranspiration resulting in increased periods of low stream flow during the peak growing season (Daley et al. 2007). Although a longer growing season typically increases forest productivity, carbon sequestration dynamics could be altered by water limitations in Northern hardwood forests. While growing seasons may initially create a carbon sink, productivity of the region's forests will likely be water and nutrient limited over the long term.
Indeed, climate change is accompanied by much uncertainty regarding the future of the region's forests. Increased pest outbreaks, range shifts leading to increased competition between species, and water limitations are some of the stressors that will face sugar maple trees in Vermont. Knowledge regarding the alteration of seasonal developmental events and the consequent lengthening of the growing season provides an ecologically and economically relevant backdrop to these environmental changes.
Despite a later-than-normal spring in 2014, sugar maples continue to show a trend towards earlier spring and later fall phenological events. Earlier springs may shorten the window for maple syrup production.
References
- Daley, M. J., N. G. Phillips, C. Pettijohn, and J. L. Hadley. 2007. Water use by eastern hemlock (Tsuga canadensis) and black birch (Betula lenta): implications of effects of the hemlock woolly adelgid. Canadian Journal of Forest Research 37:2031-2040.
- Frumhoff, P. C., J. J. McCarthy, J. M. Melillo, S. C. Moser, and D. J. Wuebbles. 2007. Confronting climate change in the US Northeast. Union of Concerned Scientists. , Cambridge, MA. Giorgi, F., J. W. Hurrell, M. R. Marinucci, and M. Beniston. 1997. Elevation dependency of the surface climate change signal: A model study. Journal of Climate 10:288-296.
- Sawyer, S., E. Kahler, and K. Perkins. 2013. 3.3 Food Production: Maple Syrup in Analysis of Vermont's Food System: Farm to Plate Strategic Plan. Vermont Sustainable Jobs Fund, Montpelier, VT.
- Skinner, C. B., A. T. DeGaetano, and B. F. Chabot. 2010. Implications of twenty-first century climate change on Northeastern United States maple syrup production: impacts and adaptations. Climatic Change 100:685-702.
- Skinner, M., and B. L. Parker. 1994. Field guide for monitoring sugar maple bud development. VMC Research Report #8. VT Agric. Exp. Sta. RR70. University of Vermont., Burlington, VT.
Additional Resources
VMC Project Database Links- Bud phenology: https://www.uvm.edu/femc/project/tree-phenology-monitoring-bud-development.
- Fall color and leaf drop: https://www.uvm.edu/femc/project/tree-phenology-monitoring-fall-color-leaf.