Lab 4: Basic geostatistics
Due Feb 15
- Start by analyzing the BG_GF_Census dataset from last week. However, we need to convert this to centroid points. Open it in ArcMap and ArcToolBox –>Data Management Tools –>Features –>Feature to Point to convert. Specify the output. Call the output BG_GF_Census_pt. Then, let’s generate XY coordinates for it that are in units that means something---meters. So go to ArcToolBox –>Data Management Tools –>Features –>add xy coordinates. If you open the attribute table, on the far right you should now see the units, recorded in UTM coordinates, which are in meters.
- Now open the table from that layer in S-Plus. Enable the spatial statistics module by clicking file>>load library>>spatialstats (DON’T LOAD “SPATIAL”). Let’s start by doing a variogram of total crime. Click spatial>>variogram cloud. Choose BG_GF_Census_pt as the input, Totcrime05 as the variable, X as location 1 and Y as location 2 (don’t use the fields called X Centroid or Y Centroid as they are in latitude longitude and harder to interpret). Make sure scatter plot and box plot are checked. Press apply and then screencapture the box plot (note that you don’t have to use Snagit; instead you can right click on the graph and click “copy” then right click in Word and click “paste.”). What does this seem to show? Next let’s do the empirical variogram (sptial>>empirical variogram). Choose the same inputs, only this time check “plot variogram” and write “totcrime” in the Save as box. Look at the output. Now let’s increase the density of bins (points). Go back to the empirical variogram interface and this time click the options tab and choose 40 lags and also increase the Max Distance to 16000 meters. Click apply and screencapture the result. Where does the gamma value seem to be leveling off for this? Now let’s do a model variogram. Click spatial>>model variogram. Choose totcrime as the variogram object and choose a Gaussian function. Then check “fit parameters.” Click apply. Screencapture the plot and [Q1] report the three parameters, interpreting what they mean. Keep in mind that in S Plus the actual sill is the reported sill plus the nugget.
- Let’s now try the again, but with an actual point data set that has much more data. Copy the sample_props2 feature class from \NR245\lab_data.mdb into your geodatabase and then import the table into SPlus using import>>from database.
- Do an
empirical variogram of the percentage of grass
by property (DON’T DO A VARIOGRAM CLOUD ON A
DATASET THIS BIG!). Click Spatial>> empirical variogram
then choose GRASS_PER as the variable and X_UTM as location 1 and Y_UTM as
location 2. Set the number of lags to 40 and the max distance to
12000(again, that’s in meters) (remember that you shouldn’t have a maximum
distance of more than half of your greatest map distance, and Baltimore is
not as long as the Gwynns Falls). Under “save
as” type “grass.” This will save a model object for use later.
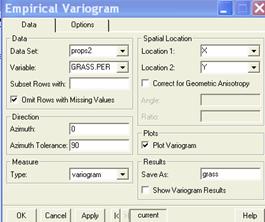 Click apply and copy/paste or make a screencapture.
(Note that if you use a different MaxDistance or
leave it blank you will get a significantly different estimate of the
range parameter). Now click Spatial>>model variogram and under variogram
object, choose “grass.” Choose Spherical as the function. Check the “fit
parameters” box. Accept the defaults and click apply.
Copy and paste or screencapture the plot. [Q2] Report and interpret the range, sill and nugget. If you have time, try changing some of
the parameters to see how that changes the curve. Try the same thing with
another variable—this time number of full bathrooms (FBTH.NUMB). Keep the
number of lags at 40 but leave the Max Distance blank. Copy and paste or screencapture
the plot. [Q3] Report the
fitted model parameters for the spherical model. How does the range seem
to change from the last model to this one and what does that indicate
about the two variables?
Click apply and copy/paste or make a screencapture.
(Note that if you use a different MaxDistance or
leave it blank you will get a significantly different estimate of the
range parameter). Now click Spatial>>model variogram and under variogram
object, choose “grass.” Choose Spherical as the function. Check the “fit
parameters” box. Accept the defaults and click apply.
Copy and paste or screencapture the plot. [Q2] Report and interpret the range, sill and nugget. If you have time, try changing some of
the parameters to see how that changes the curve. Try the same thing with
another variable—this time number of full bathrooms (FBTH.NUMB). Keep the
number of lags at 40 but leave the Max Distance blank. Copy and paste or screencapture
the plot. [Q3] Report the
fitted model parameters for the spherical model. How does the range seem
to change from the last model to this one and what does that indicate
about the two variables?
- Now, go back to Arc Map. This step won’t work with a geodatabase on the currently configured machines in 101 Aiken, since they are lacking service pack 3, and without that service pack Geostatistical analyst crashes on this exercise when using a geodatabase. Hence, in Arc Catalog (or Arc Map) export sample_props2 to a shapefile (in catalog, right click>>export>>shapefile). If you’re doing this on a machine where ArcGIS has SP3 installed, no need to convert to shapefile. Now, in Arc Map, make sure the Geostatistical analysis extension is enabled. Then go to the Geostatistical analyst toolbar (not toolbox). If you don’t see it, hit “customize>>toolbars” and then check geostatistical analyst. Click the “geostatistic analyst” dragdown button and choose “geostatistical wizard,” then “kriging/cokriging” as the method, sample_props2 as the data and GRASS_PER as the variable. Click next and then highlight both “Ordinary “ and “prediction map.” Click next. Try adjusting the lag size and number of lags to adhere to our rule of having the total x axis be no longer than the maximum map distance/2. Take a screencapture of the semivariogram. Keep in mind that the x axis is in meters*10^4. So, for instance, 0.1 is 1000 meters Go to the next screen and preview the surface. Click next and take a screencapture of the prediction plot. [Q4] Briefly interpret what you see in both the semivariogram and prediction plot. What does the blue line mean in the latter? Click finish, and screencapture the display.
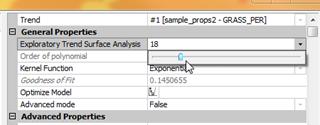
- Now let’s try universal Kriging. Again click Geostatistical analysis>>Geostatistical wizard, choose kriging as the method, sample_props2 as the data and GRASS_PER as the variable. On the next screen, this time choose universal under Kriging Type and prediction map under output type. Under Dataset #1 change “order of trend removal” to “first.” Click next. The resulting map should show you the general trend of there being less grass in the industrial south east of the city and more grass in the residential north west. Now try tweaking the first order trend slider bar. Click on the dragdown icon next to “exploratory trend surface analysis”. Now try sliding it to a bunch of different locations and look at what happens to the map. Finally, try about 30%. Take a screencapture. [Q5]Explain why changing the trend surface slider bar affects the map. What’s the difference between a high and low value of the slider?
Now click next. Again, set the lag size so that you’re at least close to D/2. Click next twice and then check out the RMS error and compare to the last time. Take a screencapture of the resulting prediction map. Then Right click on the universal kriging map in the TOC and click “change output to prediction standard error map.” Overlay the points on that map and screencapture and [Q6] briefly describe what the pixel values signify.