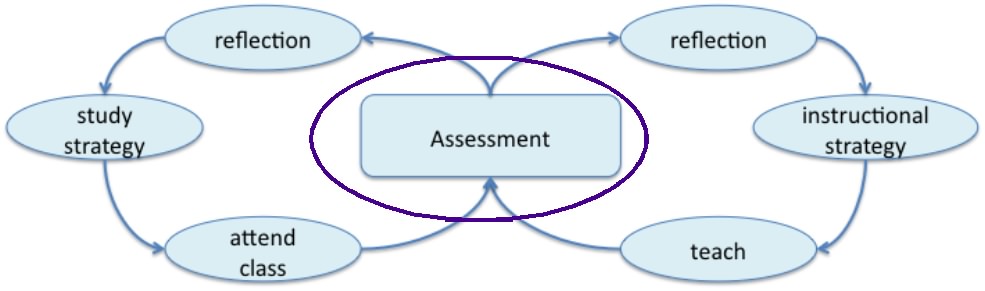
Faced with this problem, I taught myself to use the quiz function offered in both Blackboard and Moodle teaching platforms. My quizzes included questions that ran the gamut from straight factual recall to analysis of text and problem solving. Unfortunately, while Moodle quizzes allow the instructor to look at responses on questions in quizzes pulled randomly from question pools, Blackboard does not. So when teaching with Moodle, both feedback loops in the schematic can be used; when teaching with Blackboard, only the student feedback loop is available.
Structuring the quiz questions to help students work at higher cognitive levels (Krathwohl's 2002 revision of Bloom's Taxonomy) requires some advance work both in the classroom (so that students are not frustrated by encountering problems that are too difficult) and outside of the classroom (so that as an instructor, I'm not scrambling the night before a quiz "opens" online to get problems written). Strategies for the former will be discussed on my page about working through pre-existing misconceptions, here I discuss strategies for writing diverse kinds of quiz questions.
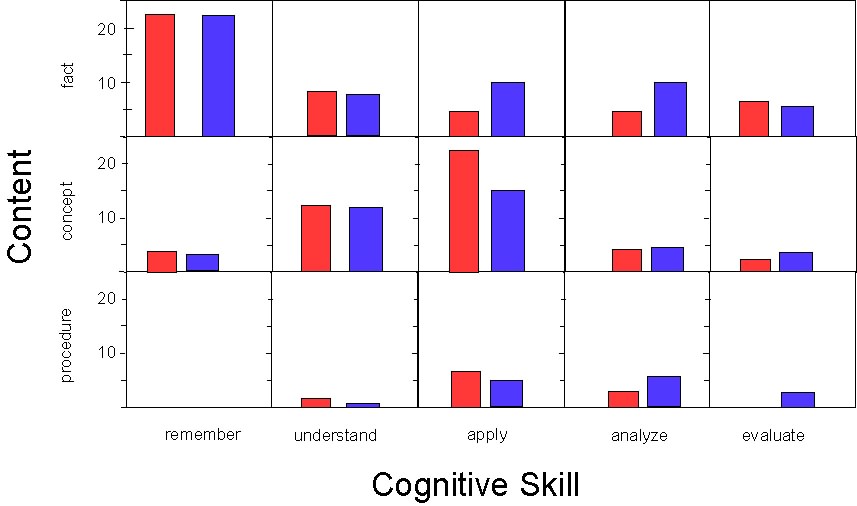
Krathwohl's version of Bloom's taxonomy of tasks places items in a two-dimensional matrix, with one dimension for content and the other for cognitive level. The end result, with my quiz and exam questions mapped, is seen below, with exam questions in red and quiz questions in blue (no difference in quiz and exam taxonomy: Chi-squared =2.44, p=0.88; when a question fell into two categories, such as remembering and applying procedures, I classified it at the higher taxonomic category).
The appropriate unit for measuring evolution is the _____ while the appropriate unit for measuring selection is the ________.
- laboratory strain, natural population
- natural population, laboratory strain
- population, individual
- individual, population
- parent,
offspring
Understanding
facts:
Which of the following is not required
for a population to evolve through natural
selection?
- variation in phenotype
- variation in phenotype is inherited
- variation in phenotype produces differences in fitness
- variation in phenotype causes differences in competitive ability*
Garter snakes vary in color pattern (checkered or striped), and the pattern of a particular individual is genetically determined. You have found a population where there are individuals with both patterns. What additional information do you need to know in order to determine if the color pattern will change through natural selection?
- Do females prefer males of a particular color?
- Do individuals with stripes crawl more quickly?
- Do checkered individuals produce more offspring?
- Do striped snakes have striped offspring, and checkered snakes checkered offspring?
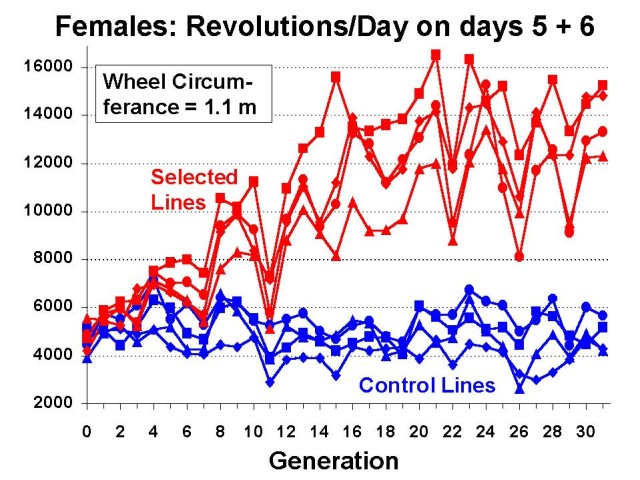
Data with used with permission from Ted Garland.
- At the start of the experiment, the mice assigned to "control" and "selection" groups had the same running behavior.
- The selected lines became significantly more likely to run compared to the original population.
- There was heritable variation among mice for running behavior.
- 1 and 2
- 1, 2 and 3
- Artificial selection cannot change the tendency of mice to run in the laboratory.
- There is insufficient heritable variation in running behavior for selection to act upon.
- Mice that run more easily in the laboratory will more easily escape predators in the wild.
- 1 and 2
- 1, 2 and 3