When you create a report in Access, the summary statistics are often more important than the individual records. One useful property for improving summary data is Running Sum.
This month's article includes many steps, so we kept our explanations of basic report tasks short (which might be difficult for beginners to follow). To do this tutorial, you'll need to understand sorting and grouping. Also, please note that the report you'll create isn't a model of good design; its only purpose is to show you how Running Sum works. Because this tutorial requires you to edit data in the Northwind database, we recommend that you make a copy of the file before proceeding. Navigate to the Northwind.mdb database in the Samples subfolder of your Microsoft Office folder. Copy Northwind.mdb to the Clipboard and paste it in another folder. Rename the file CopyOfNorthwind.mdb, which you can now open and use without worrying about changing the original file. In the Database window, double-click the Orders table to open it. Note that the table contains fields for the order date and the country to which the order was shipped. In the Record Selector area, note that the total number of orders is 830, and then close the Orders table. Let's create a report that groups all the orders first by country and then by year, as well as one that counts the number of orders. With Orders selected in the Database window, choose Report from the Insert menu. Select Report Wizard and click OK. In the first dialog box, double-click OrderID, OrderDate, and ShipCountry in the Available Fields area to add them to the Selected Fields area. Click Next. Select ShipCountry and click the top arrow button (has a > icon) to group orders by country. With OrderDate selected, click the top arrow button (again, the one with a > icon) to group orders by order date. Click the Grouping Options button. In the OrderDate row, open the drop-down menu, select Year, and click OK. Click Next four times to move to the last dialog box in the wizard. Type Orders by Country and Date for the title and click Finish. Your report should look like Figure 1. Click the View button to switch to Design view. Choose Sorting And Grouping from the View menu and click inside the ShipCountry row. Change the Group Footer field to Yes. Click inside the OrderDate field in the second row (the one with the grouping sign on the left). Again, change the Group Footer field to Yes. Close the Sorting And Grouping dialog box. As you'll see in the report, there are now footers for ShipCountry and OrderDate. Click the Text Box tool in the toolbox, drag it to the OrderDate Footer, and click when you see that the crosshairs are 1 inch from the left. To count orders, click inside the text box (the box on the right) and type the expression =Count([OrderID]) . Then, select the label on the left, click inside it, and change the label by typing Total . Select the text box and choose Duplicate from the Edit menu. In the new text box/label combination that appears, select the label and change it by typing Running Sum . Right-click its accompanying text box and choose Properties. Choose the Data tab and click inside the Running Sum property field. Open the drop-down menu and select Over Group. Close the property sheet. Right-click the original text box you created and choose Copy. Right-click the ShipCountry Footer and select Paste. Change the Total label in the ShipCountry Footer to "Country Total" by typing Country before the word "Total." Save your changes. Click the View button to see the report. The orders are grouped first by country and then by year. On page 1, both the Total and Running Sum of the 1997 order count for Argentina are 6. For 1998, however, the Total is 10 and the Running Sum is 16 because the Running Sum includes both 1997 and 1998 orders. Plus, the Running Sum is the same as the Country Total because the Running Sum includes all years in which orders were made to Argentina. You may have noticed that when you selected Over Group from the Running Sum property's drop-down menu there was another choice called Over All. How do these two options differ? When you choose Over Group, you keep adding sums until a new group starts. For example, at the bottom of page 1, a new country group, Austria, starts. If you go to the top of page 2, you see that the Running Sum has started anew for this country. The total number of orders to Austria for 1997 is 8, and the Running Sum also is 8. Now let's see how Over All works. Click the View button to return to Design view. In the OrderDate Footer, right-click the text box next to Running Sum and select Properties. On the Data tab, click inside the Running Sum field, open the drop-down menu, and select Over All. Close the property sheet. Click the View button to see the report. At the top of page 2, note that the Running Sum that had been 8 is now 24 because Access calculates this over the entire report and not just for the year groups within a particular country. If you scroll through the report, you'll see that the Running Sum continues to grow, despite the various beginnings and endings of country groups. Then, at the end of the report, note that the final Running Sum is 830the same number of orders that's in the Orders table.
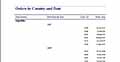
Figure 1. As you can see, this type of report groups orders by country and then by year. ![]() Create A Report
Create A Report
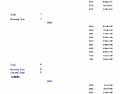
Figure 2. You can set up the Running Sum so it accumulates the order count for year groups. ![]() Add Count Totals To The Report
Add Count Totals To The Report
![]() Compare Over Group With Over All
Compare Over Group With Over All