Questions?
Syllabus Objectives:
1. Become familiar with information technology hardware including the basic internal anatomy of a personal computer.
2. Understand the role of Operating Systems and demonstrate knowledge of command-line UNIX, Windows 7, and OS X.
3. Demonstrate file and folder management on PC, disk, flash memory stick, and zoo home directory server and backup server.
4. Detect and elimination of Computer Viruses & Spyware and protect your PC with Zone Alarm fire-wall software.
5. Demonstrate proficiency with electronic communication: e-mail, etiquette, attachments, and signature files.
6. Be familiar with the Blackboard® environment and post journal entries.
7. Demonstrate proficiency in presentation graphics applications by giving a presentation in front of a class.
8. Demonstrate proficiency in word processing applications including tabs, hanging indent, and citing references for images and ideas.
9. Demonstrate proficiency in converting between decimal and binary numbers and an understand of using binary to code for text, images, and sound.
10. Demonstrate proficiency in spreadsheet and graphing applications including choosing the correct graph type, given a data set.
11. Understand and demonstrate how to present and interpret data in graphic form including basic descriptive statistics (central tendency and variation).
12. Understand what a peer-reviewed publication is, and the difference between primary, secondary, and tertiary data.
13. Demonstrate finding reliable, credible sources of information on the web, and sources in the University library.
14. Find useful data on the Internet, be critical of those data, and interpret those data.
15. Demonstrate knowledge of data classification (Nominal, Ordinal, Interval, etc.).
16. Understand, create, and interpret X Y scatter plots, box plots, histograms, population pyramids, and choropleth maps.
17. Create World Wide Web Pages using HTML code and publish on the web using the zoo web server.
18. Understand the history and legacy of computing.
19. Appreciate the utility, benefit, and limitations of computers and information technology.
20. Improve writing skills.
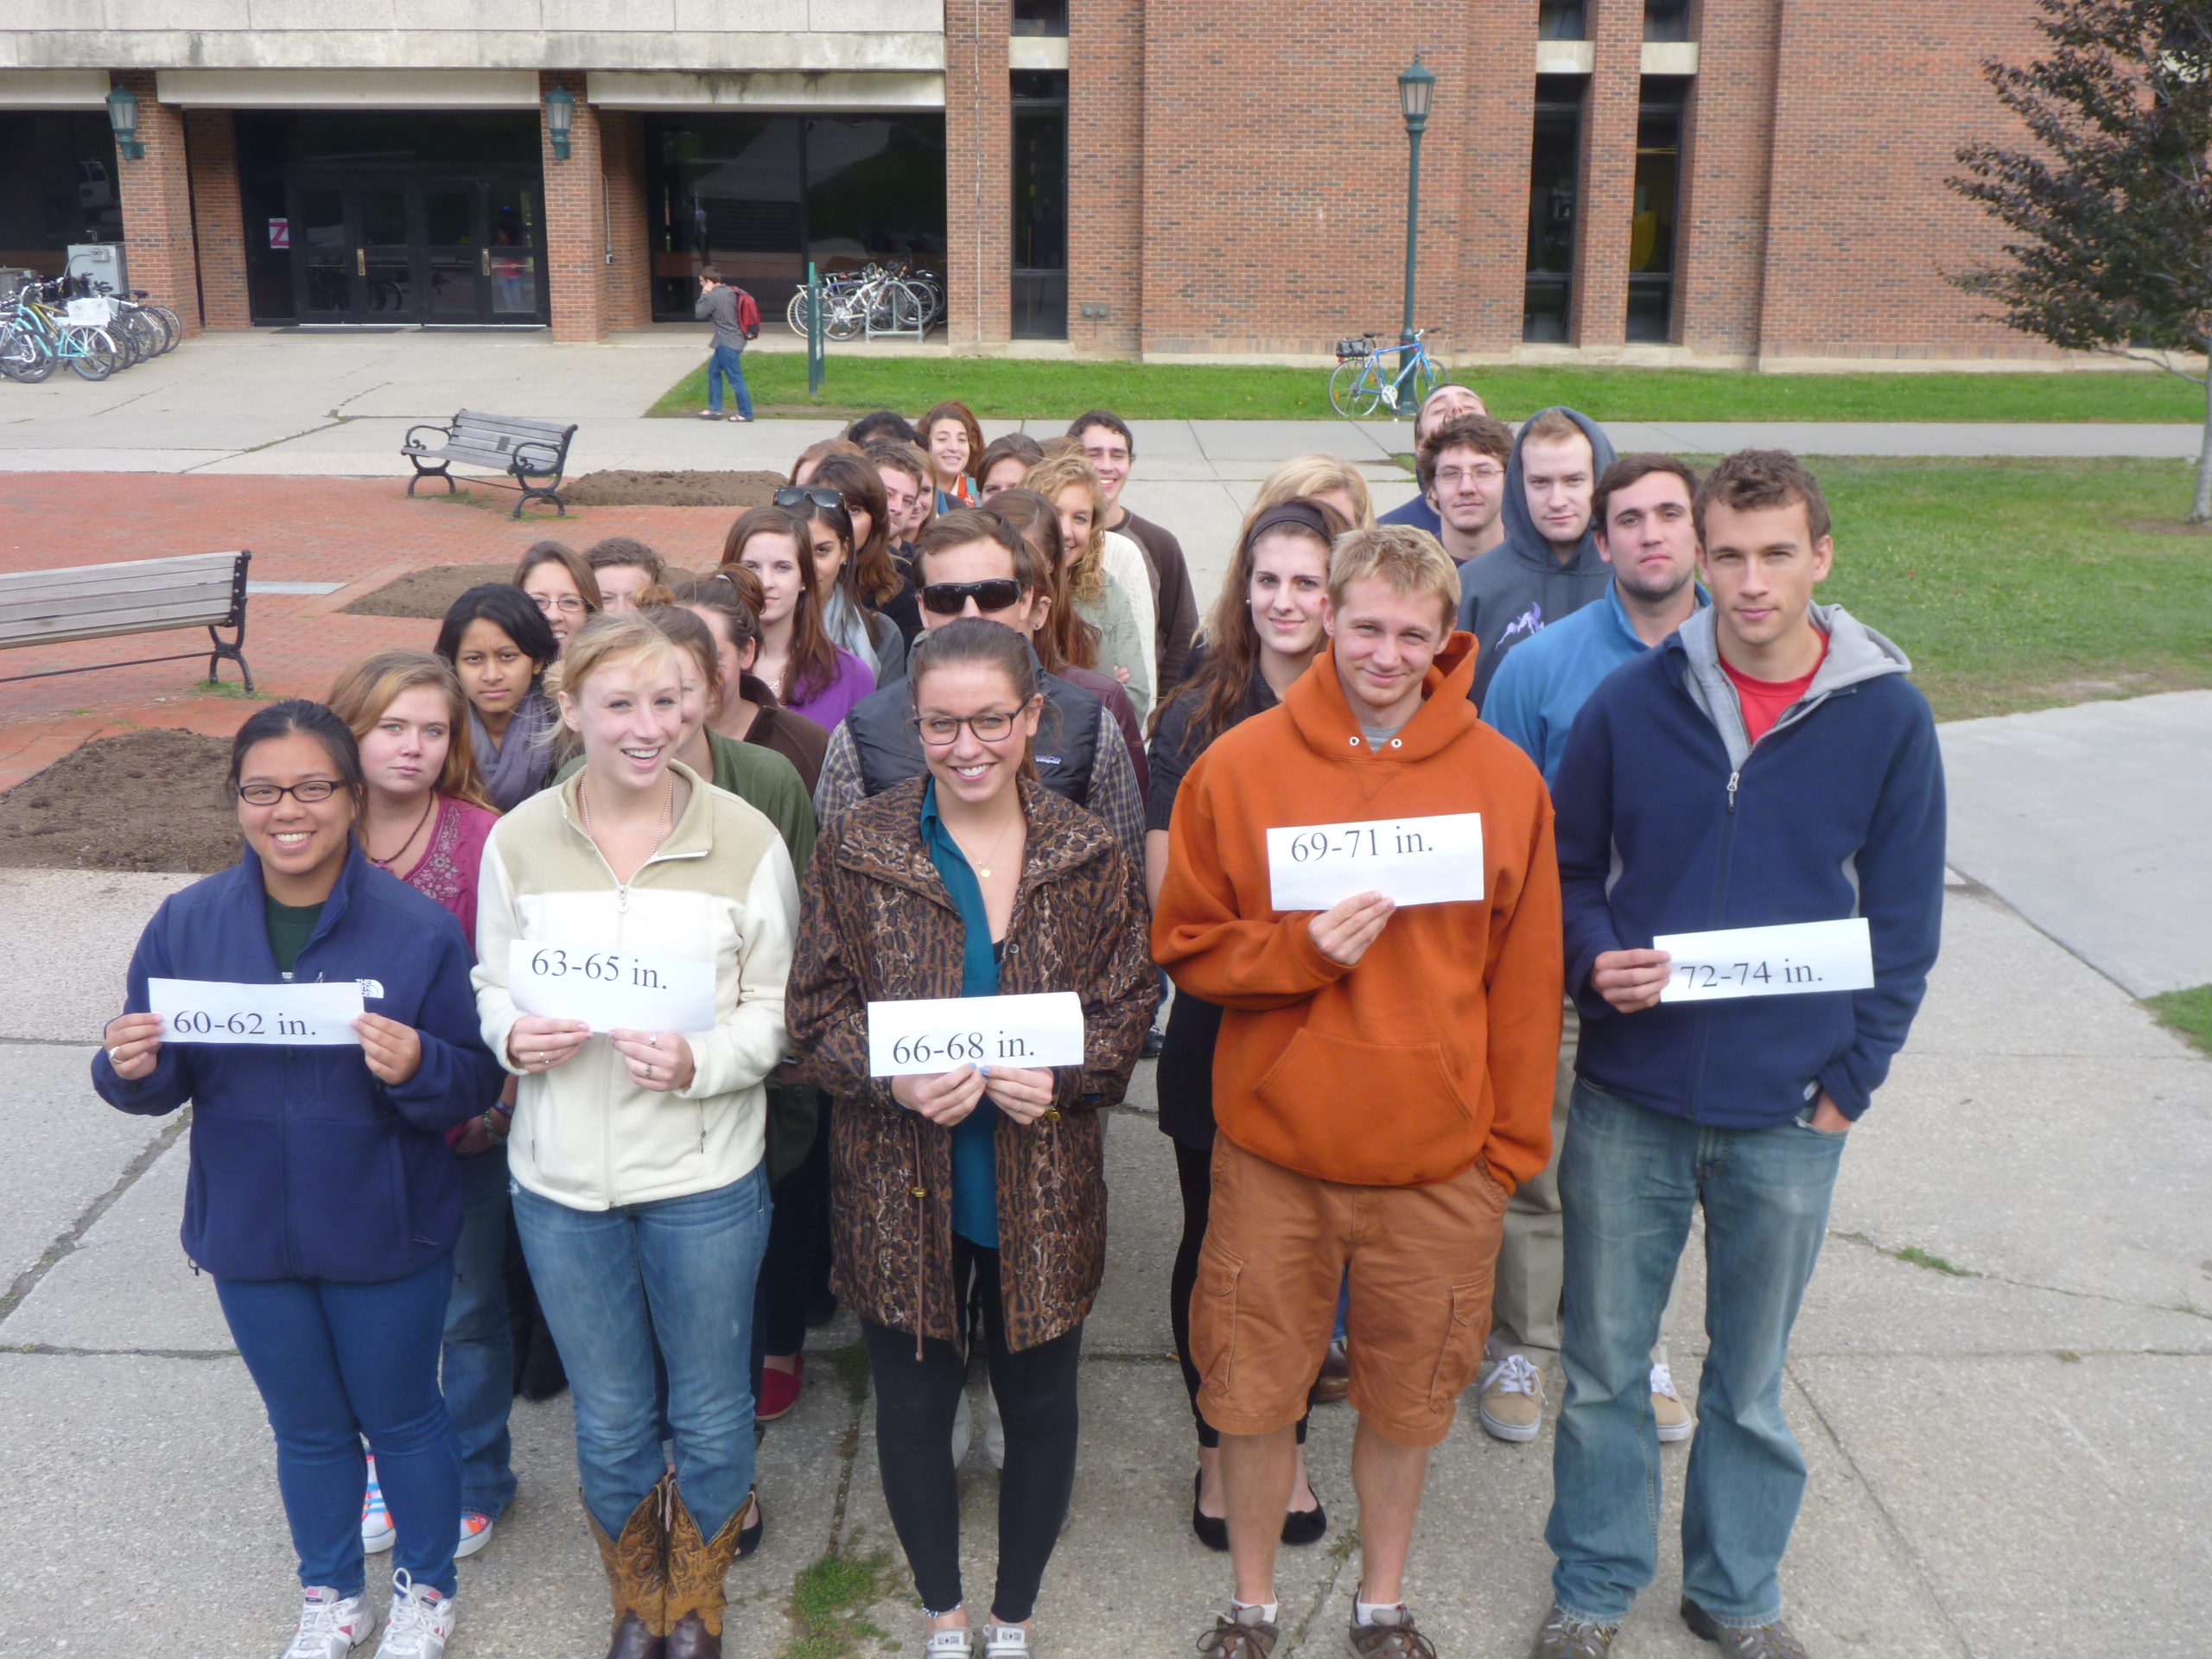
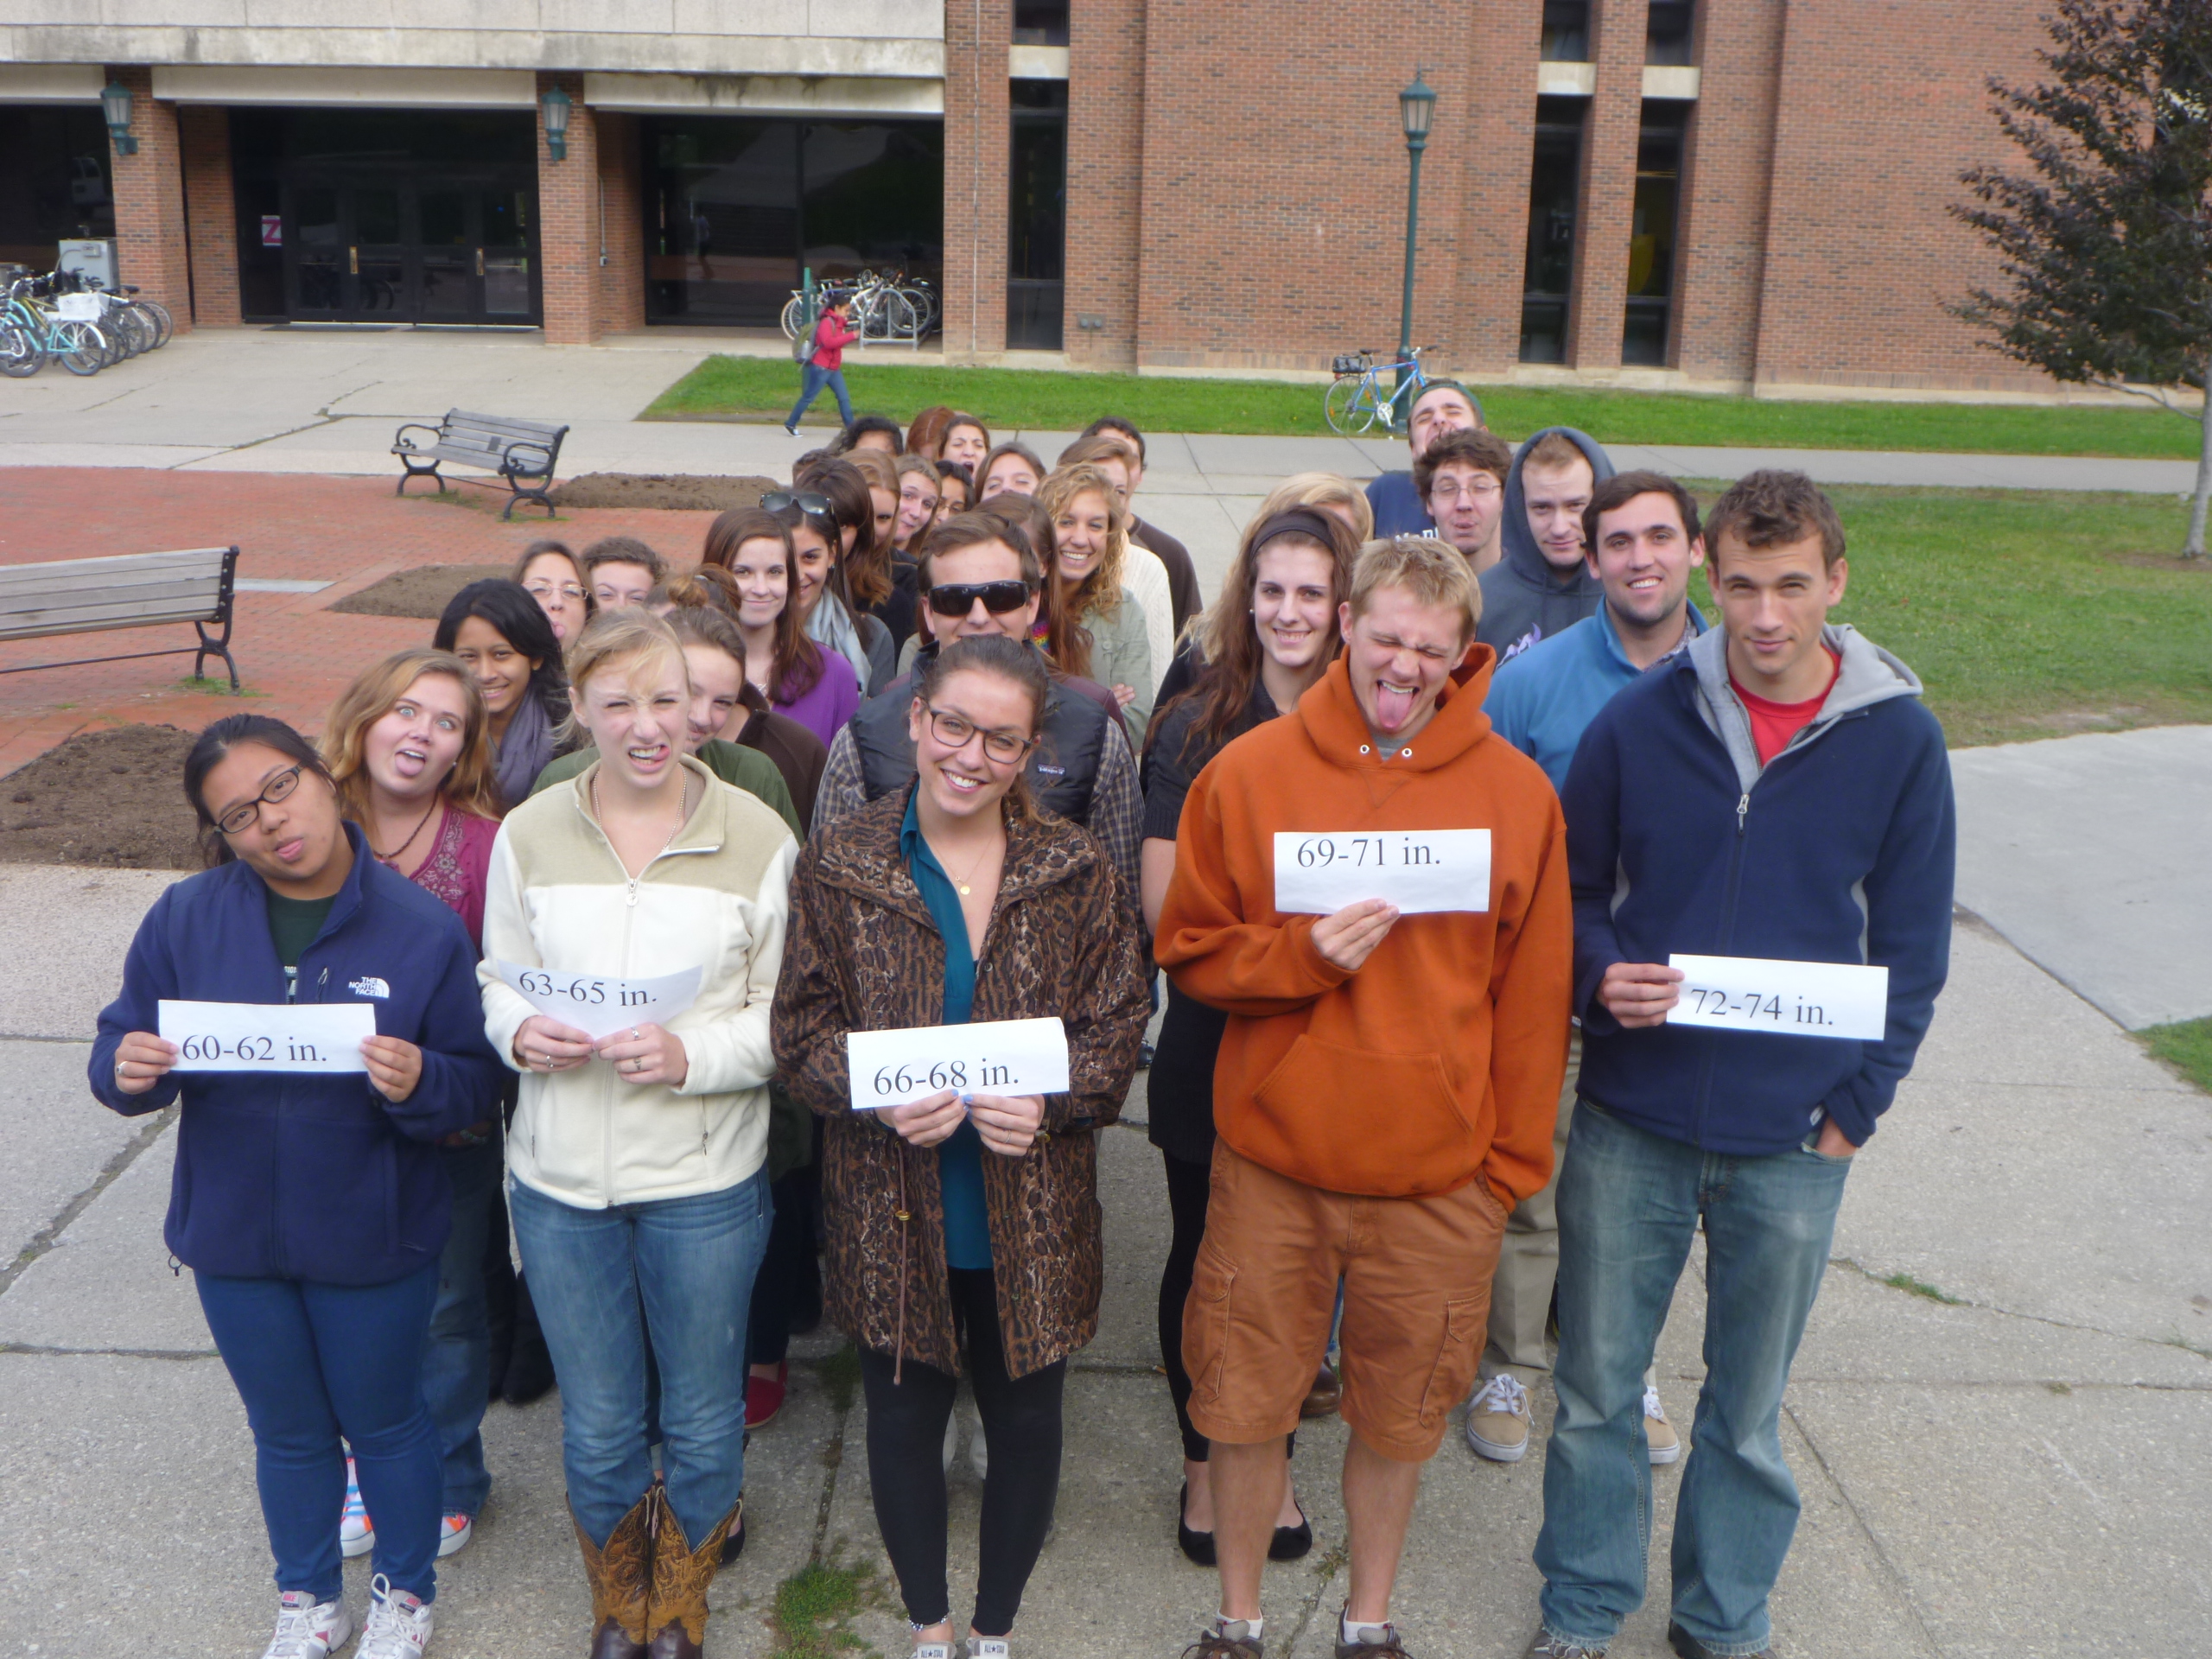
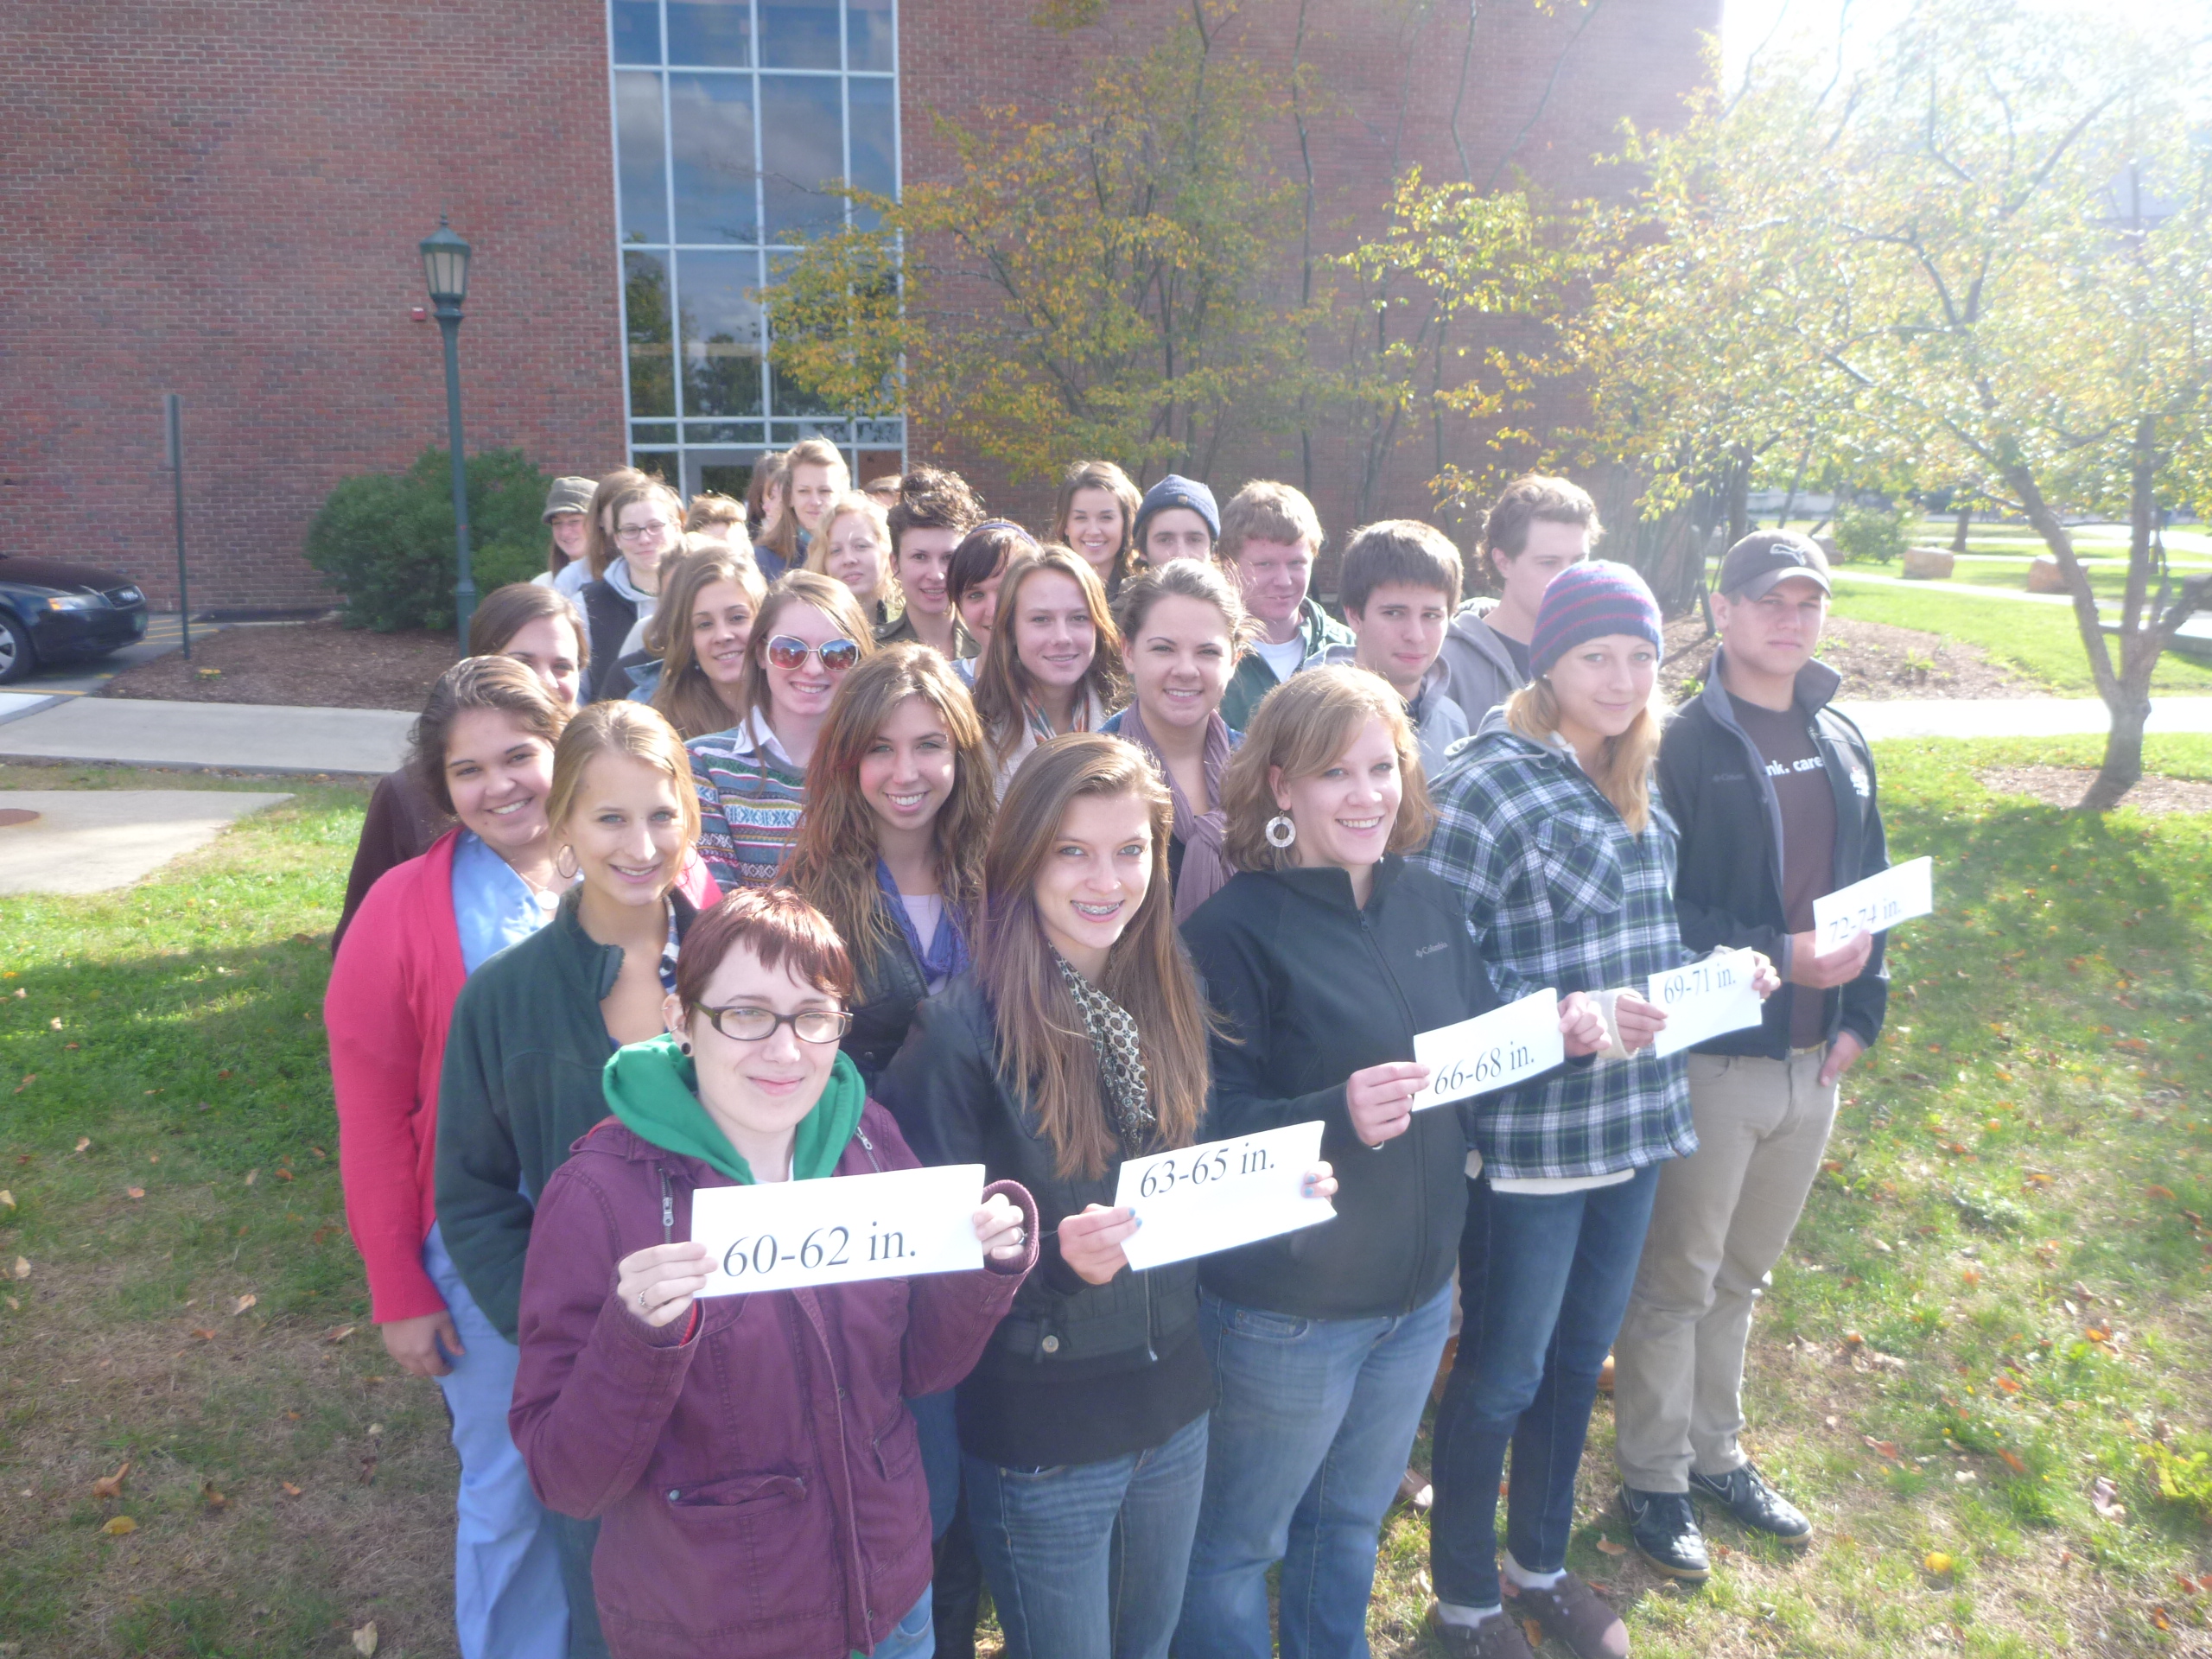
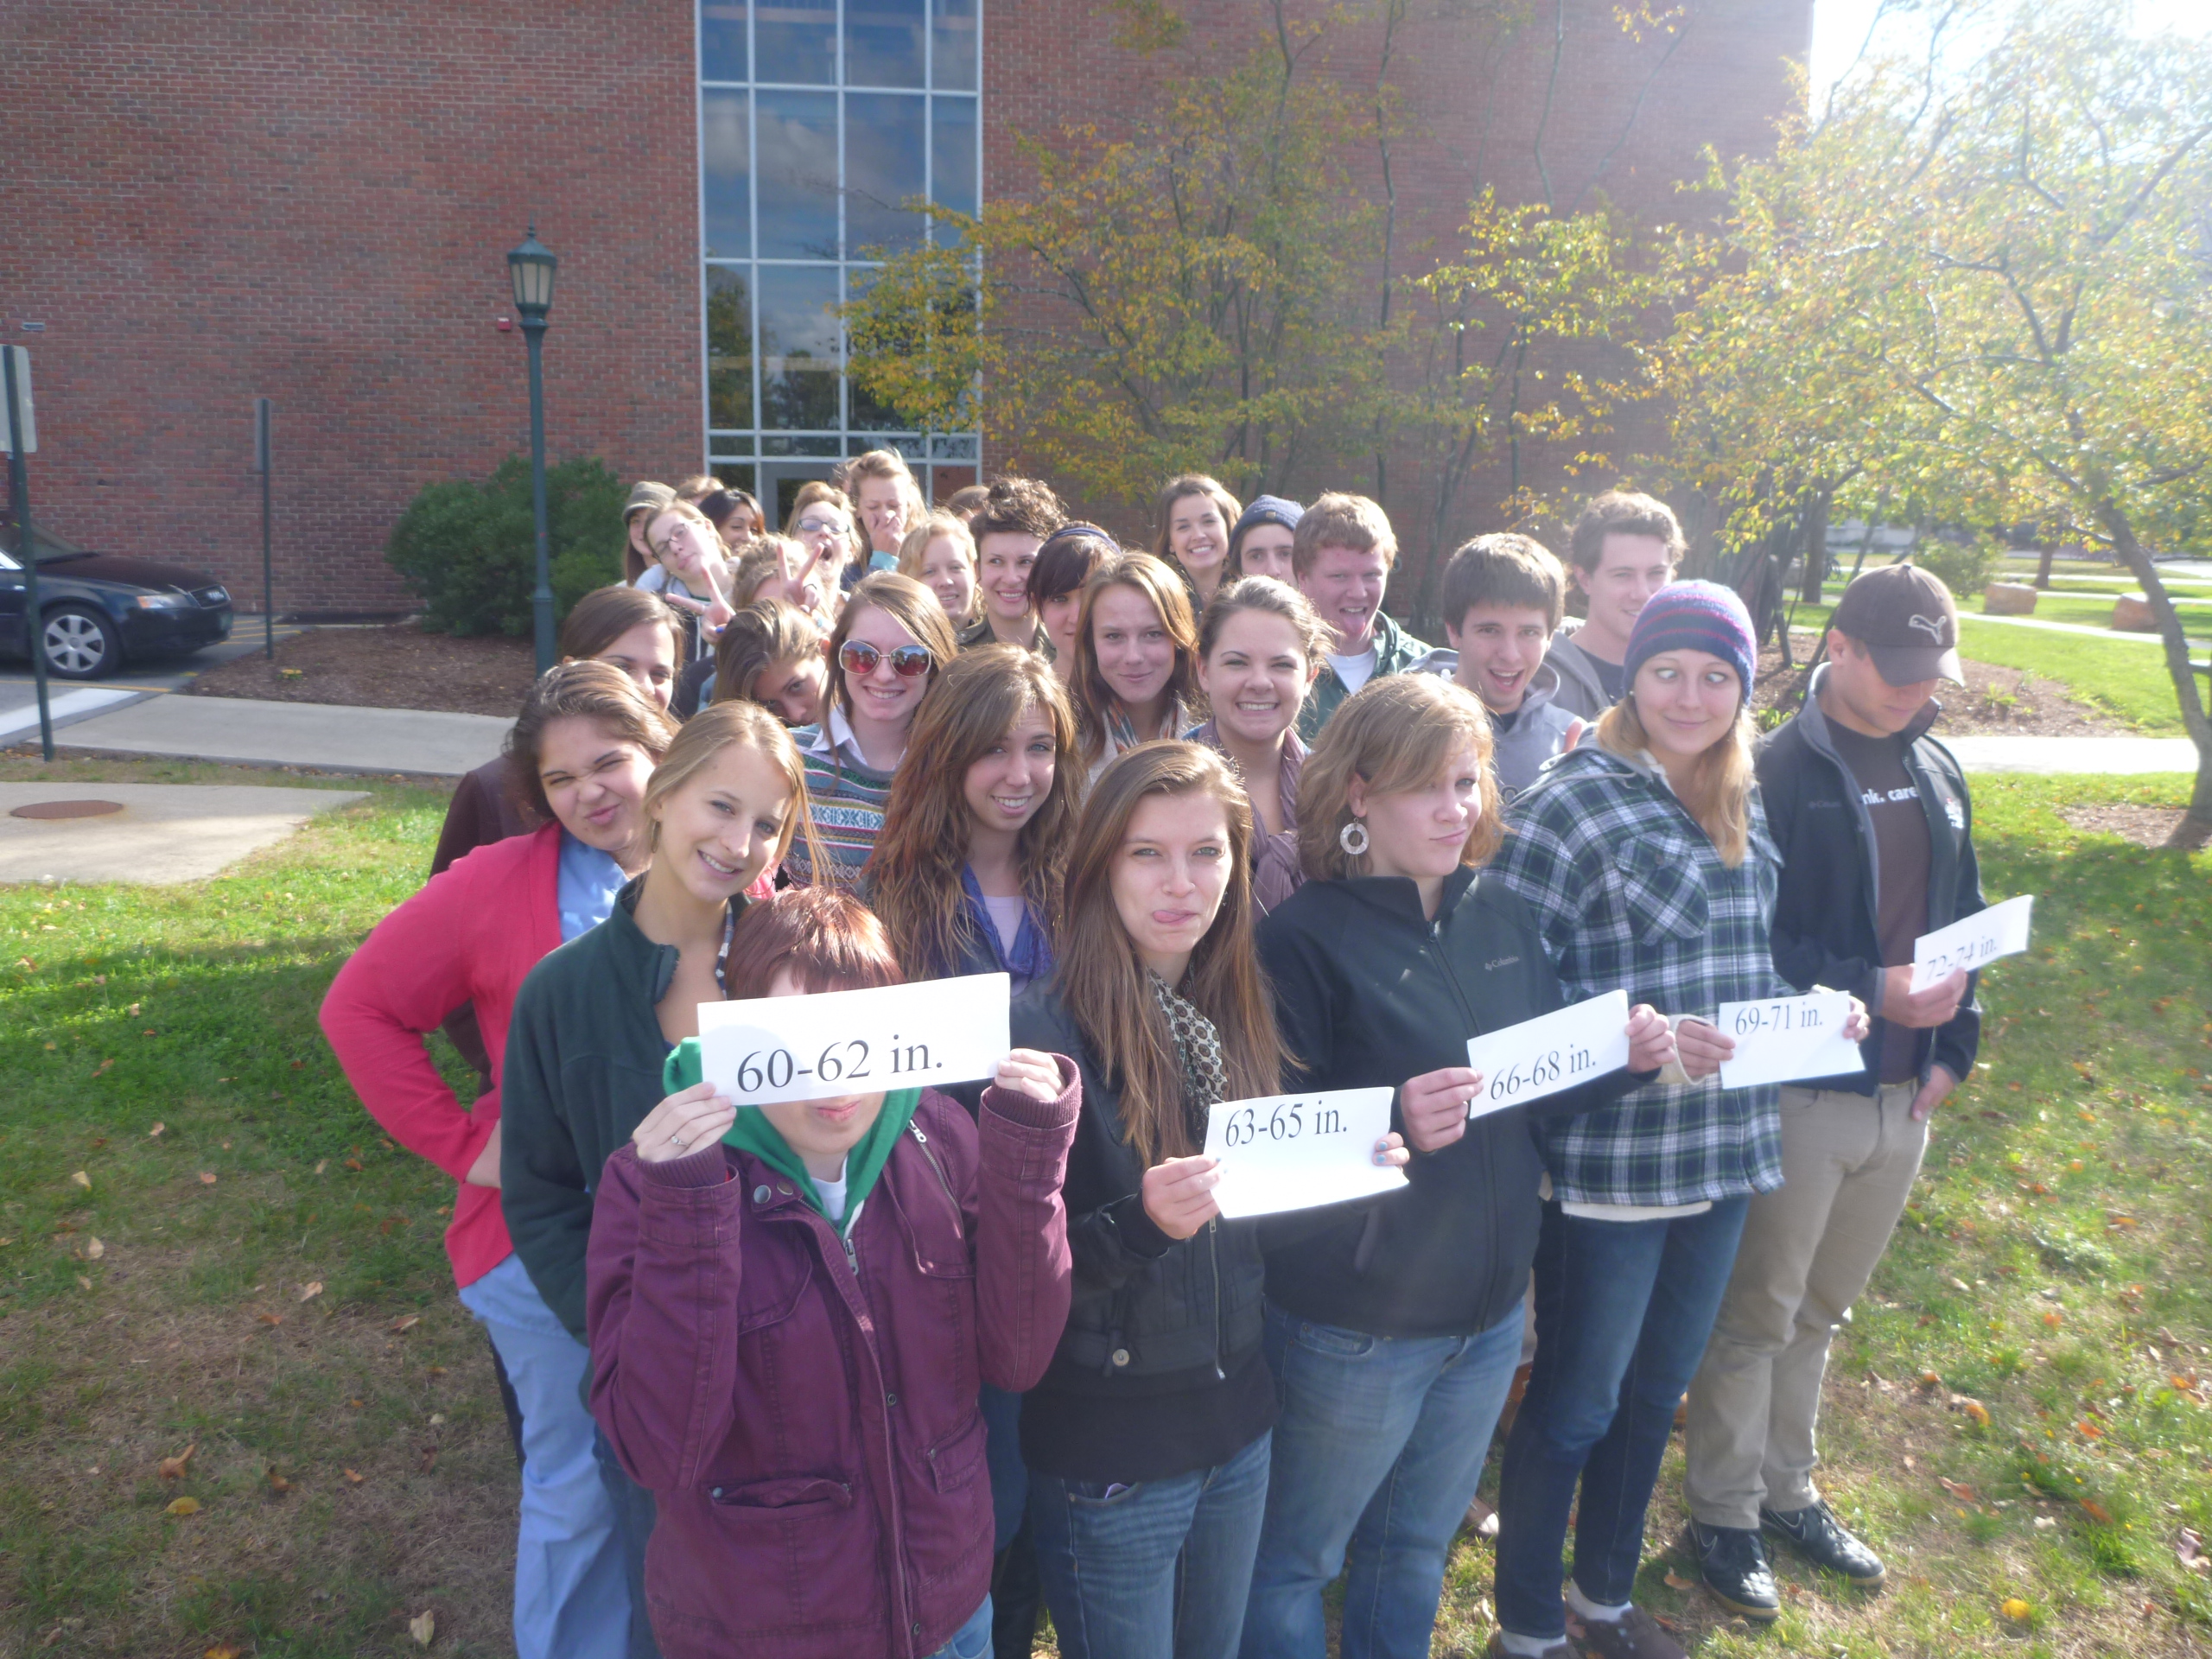
Class Histograms: Tuesday 1, Tuesday 2, Thursday 1, Thursday 2
ANNOUNCEMENTS
& ASSIGNMENTS:
NEXT EXAM: November 6 & 8. Mark your calendars.
Websites of the Week: TED Talk: Eli Pariser Beware of Online Filter Bubbles.
Preview of Lab Next Two Weeks:
This week: Second
Excel Lab: X Y Scatter Plot, Population Pyramid
Interpreting Population
Pyramids
Next week's lab: First
Web Page Lab
Reading: How Hackers Break In Sci. Am. October 1998, The Zombie Hunters (New Yorker, Oct 10, 2005). Text Sections 11-13 (pages 64-94 end of text)
LECTURE:
Online Excel Template on Syllabus for course grade
Binary Numbers: Converting Binary to Decimal, Decimal to Binary
Graph Exercise Two Review
Demographic Transitions: One, Two
Time Series: Global Land/Air Vertebrate Biomass 1850-2050
Lake Champlain Freeze-Up 1820-2010
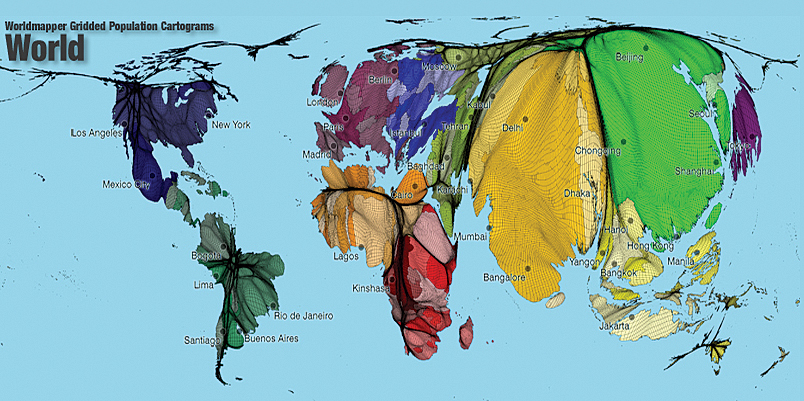
Cartograms: World Population Amphibians Endangered & New Species
Graph
Practice 3 - Last one!