Questions?
Syllabus Objectives:
1. Become familiar with information technology hardware including the basic internal anatomy of a personal computer.
2. Understand the role of Operating Systems and demonstrate knowledge of command-line UNIX, Windows 7, and OS X.
3. Demonstrate file and folder management on PC, disk, flash memory stick, and zoo home directory server and backup server.
4. Detect and elimination of Computer Viruses & Spyware and protect your PC with Zone Alarm fire-wall software.
5. Demonstrate proficiency with electronic communication: e-mail, etiquette, attachments, and signature files.
6. Be familiar with the Blackboard® environment and post journal entries.
7. Demonstrate proficiency in presentation graphics applications by giving a presentation in front of a class.
8. Demonstrate proficiency in word processing applications including tabs, hanging indent, and citing references for images and ideas.
9. Demonstrate proficiency in converting between decimal and binary numbers and an understand of using binary to code for text, images, and sound.
10. Demonstrate proficiency in spreadsheet and graphing applications including choosing the correct graph type, given a data set.
11. Understand and demonstrate how to present and interpret data in graphic form including basic descriptive statistics (central tendency and variation).
12. Understand what a peer-reviewed publication is, and the difference between primary, secondary, and tertiary data.
13. Demonstrate finding reliable, credible sources of information on the web, and sources in the University library.
14. Find useful data on the Internet, be critical of those data, and interpret those data.
15. Demonstrate knowledge of data classification (Nominal, Ordinal, Interval, etc.).
16. Understand, create, and interpret X Y scatter plots, box plots, histograms, population pyramids, and choropleth maps.
17. Create World Wide Web Pages using HTML code and publish on the web using the zoo web server.
18. Understand the history and legacy of computing.
19. Appreciate the utility, benefit, and limitations of computers and information technology.
20. Improve writing skills.
ANNOUNCEMENTS & ASSIGNMENTS:
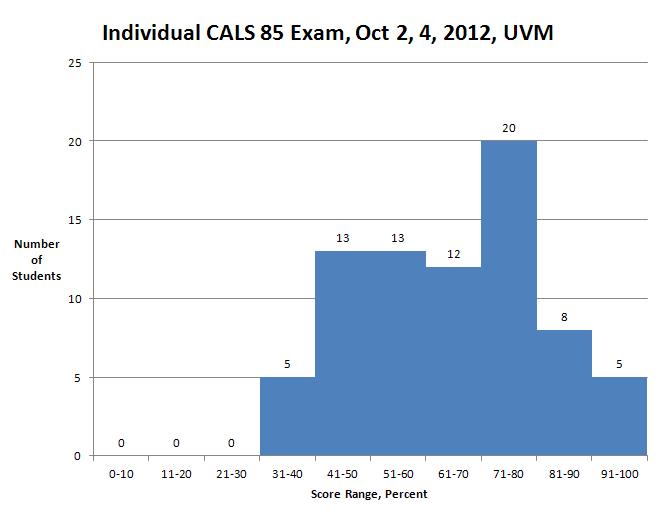
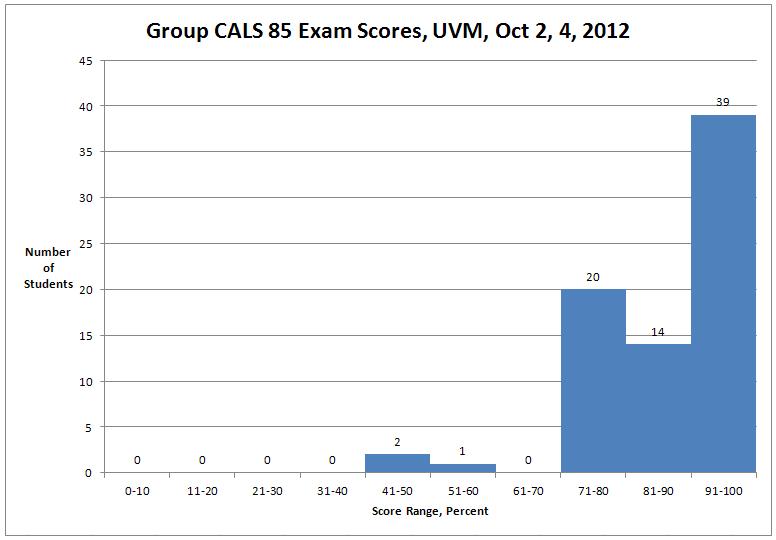
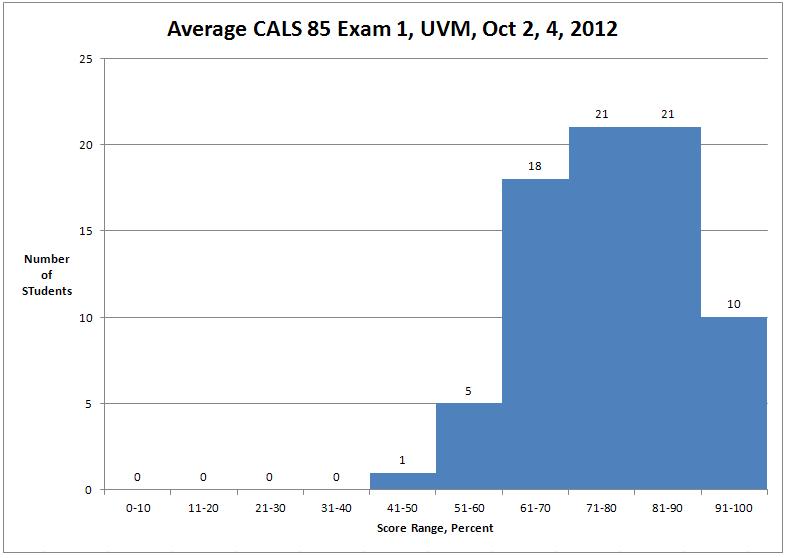
Exam Results: Individual, Group, Average
Websites
of the Week:
example
of interactive stacked area graph:
http://www.nytimes.com/interactive/2009/07/31/business/20080801-metrics-graphic.html
example of of time-series choropleth map:
http://news.bbc.co.uk/2/hi/technology/8552410.stm, TED Talk Hans Rosling, Gapminder.org
software site, Multi-tasking
Article from Standford University, TED Talk Connected but Alone (thanks to Alex Kilajian).
Preview of Lab Next Two Weeks: Go to your regular lab unless
emergency (contact TAs)
This week:
First
Excel Lab
Next
Week: Second
Excel Lab: X Y Scatter Plot, Population Pyramid
Reading:
Voyager II article, Sci. Am. Nov. 1986
Text
Sections 9-10 (pages 54-63), How
Hackers Break In Sci. Am. October 1998,
The
Zombie Hunters (New Yorker, Oct 10, 2005)
Please post to the discussion board of your lab in
Blackboard. 5% of your course grade is based on your
participation in the discussion. You should post one a week
(minimum of 14 postings for the semester).
LECTURE:
Class
Histogram: You need to know your height to the nearest inch:
4 ft = 48 inches
5 ft = 60 inches
6 ft = 72 inches
7 ft = 84 inches
Graph Practice Two Review