ANNOUNCEMENTS & ASSIGNMENTS:
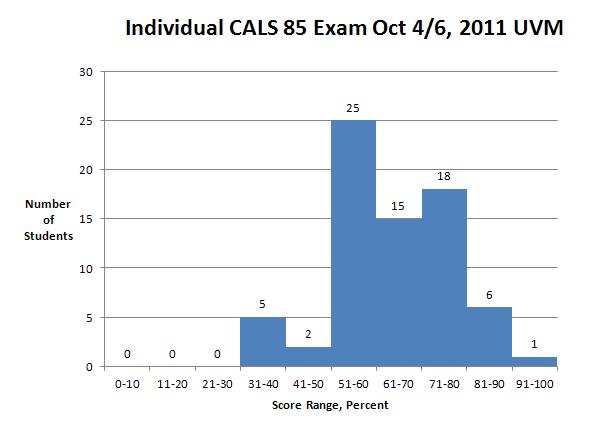
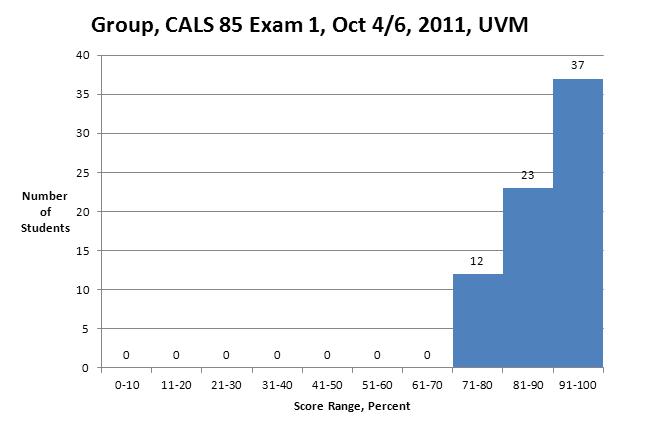
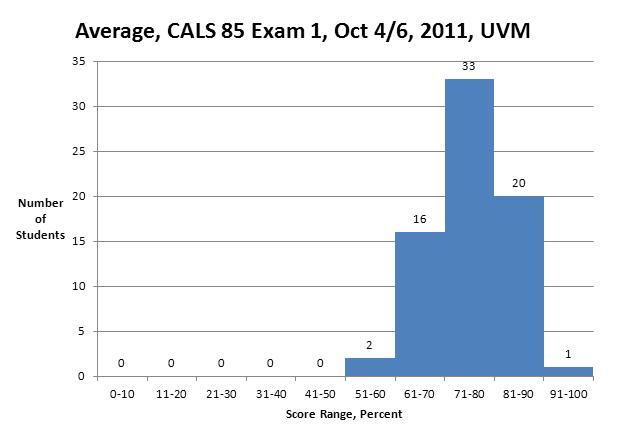
Exam Results: Individual, Group, Average
Websites
of the Week:
example
of interactive stacked area graph:
http://www.nytimes.com/interactive/2009/07/31/business/20080801-metrics-graphic.html
example of of time-series choropleth map:
http://news.bbc.co.uk/2/hi/technology/8552410.stm, Hans Rosling's TED Talk on global development, Multi-tasking Article from Standford University
Link to Triumph of the Nerds on YouTube (Thanks to Ben from the Thursday Lecture)
Preview of Lab Next Two Weeks:
This week: First Excel Lab
Next
Week: Second
Excel Lab: X Y Scatter Plot, Population Pyramid
Reading:
Voyager II article, Sci. Am. Nov. 1986,
Optical
fibers.
Text
Sections 9-10 (pages 54-63)
Please post to the discussion board of your lab in
Blackboard. 5% of your course grade is based on your
participation in the discussion. You should post one a week
(minimum of 14 postings for the semester).
LECTURE:
Class Histogram
Graph Practice Two